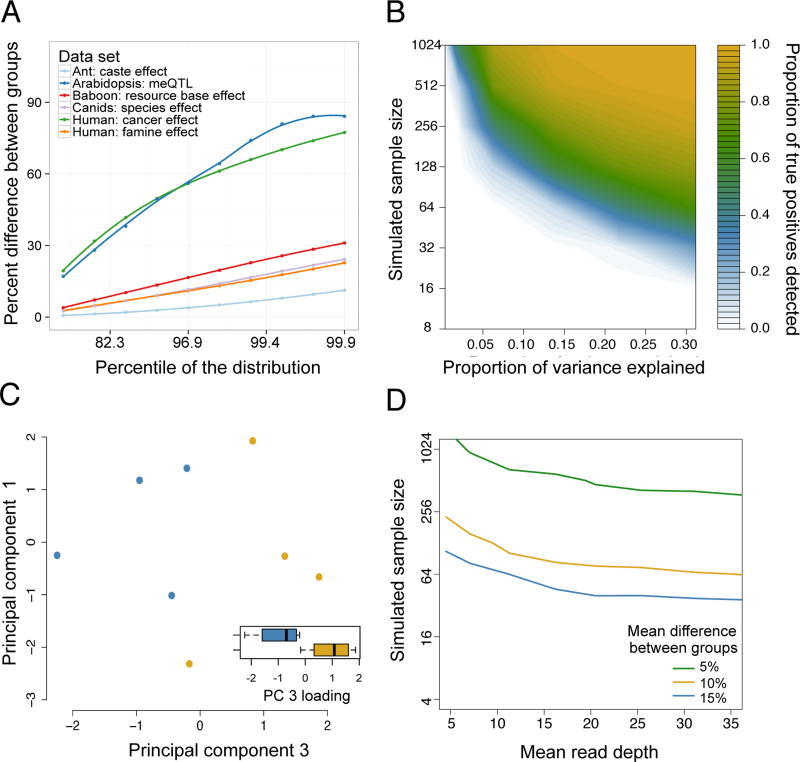
Figure 2. Estimates of effect sizes and their impact on the power of differential methylation analysis.
(A) The maximum percent difference in mean DNA methylation levels between two sample groups (y-axis), for selected percentiles of sites (x-axis, ranked from smallest to largest percent difference) in reanalyzed data sets (Table 1) with binary predictor variables. Mean differences are based on raw values, without correction for covariates. We show the largest percentiles here because those effects are most likely to be detected and of interest. (B) Power to detect differentially methylated sites at a 5% FDR in simulated RRBS datasets (sample size is plotted on a log scale). The magnitude of the effect of interest on DNA methylation levels (x-axis) is represented as the proportion of variance explained. (C) In a small ant data set (n=8), site-by-site analyses are underpowered to detect differential methylation between reproductive phase (blue dots) versus brood care phase (yellow dots) individuals, but PCA separates samples by caste (t-test for PC 3, which explains 21.7% of the overall variance: p = 0.022). In 1000 permutations, only 8.8% of permutations separate as cleanly on any of the first five PCs, suggesting that the original analysis was power-limited. Whiskers on boxplots represent the values for the third and first quartiles, plus or minus 1.5× the interquartile range, respectively. (D) The sample size and mean read depth combinations required to achieve 25% power (i.e., detect 25% true positives) in simulated RRBS datasets, for 3 different effect sizes. Increases in read depth do not affect power beyond ~20× coverage, and sample size or effect size increases always increase power more (Supplementary Figure 5).

