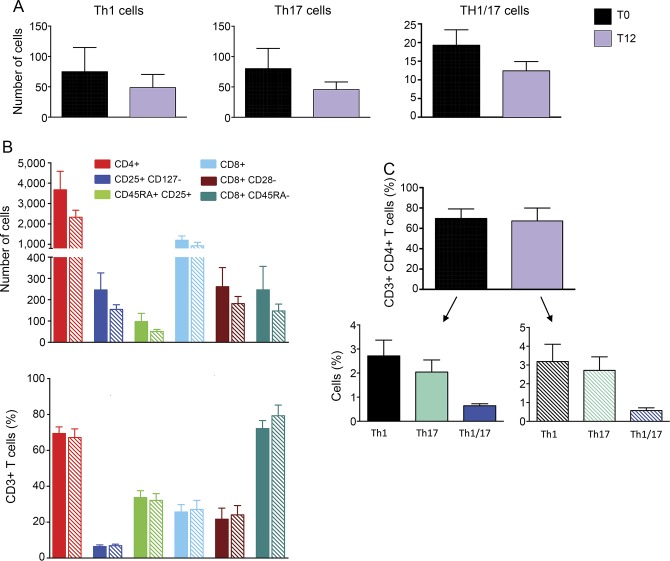
Figure 2. T effector and regulatory cell numbers show a slight trend in reduction after 12 months of teriflunomide treatment.
Effector T-cell populations were assessed as Th1 (CD3+CD4+CCR6−CD161−), Th17 (CD3+CD4+CCR6+CD161+), and Th1/17 (CD3+CD4+CCR6+CD161+CXCR3highCCR4low). Regulatory T-cell subpopulations were assessed as CD3+CD4+ (including Treg CD25+CD127− and Treg-naive CD45RA+CD25low) and CD3+CD8+ (including Treg CD28− and Treg–naive CD28−CD45RA+). (A) T effector cell numbers show a trend in decrease after 12 months of treatment. (B) The proportion between different regulatory T-cell subsets is not affected by teriflunomide (lower panel). The number of cells is slightly reduced in all subpopulations after 12 months of treatment (upper panel). (C) The proportion between different T effector cell subsets is not affected by the treatment. Data are presented as mean ± SEM for 7 treated patients with MS.

