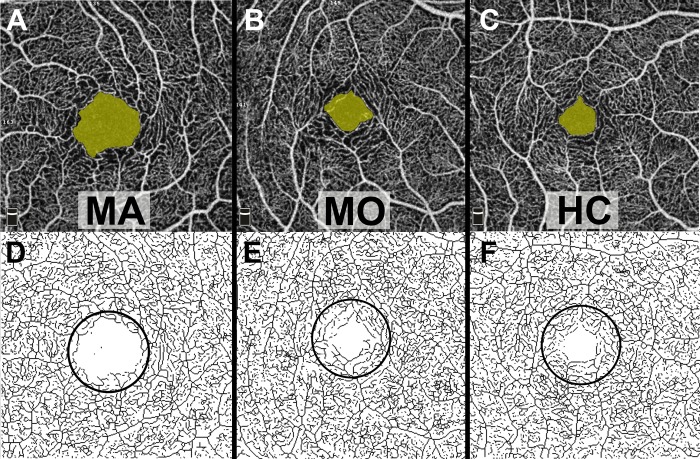
Figure 4.
Representative macular OCTA scans of MA, MO, and HC participants. The FAZ area is shaded yellow in the top row. In the bottom row, the skeletonized OCTA images of the SCP were used for the assessment of foveal VD within the outlined 1 × 1 mm circular area. Qualitatively, the FAZ area is enlarged and foveal VD decreased in the MA participant when compared with the MO and HC participants.

