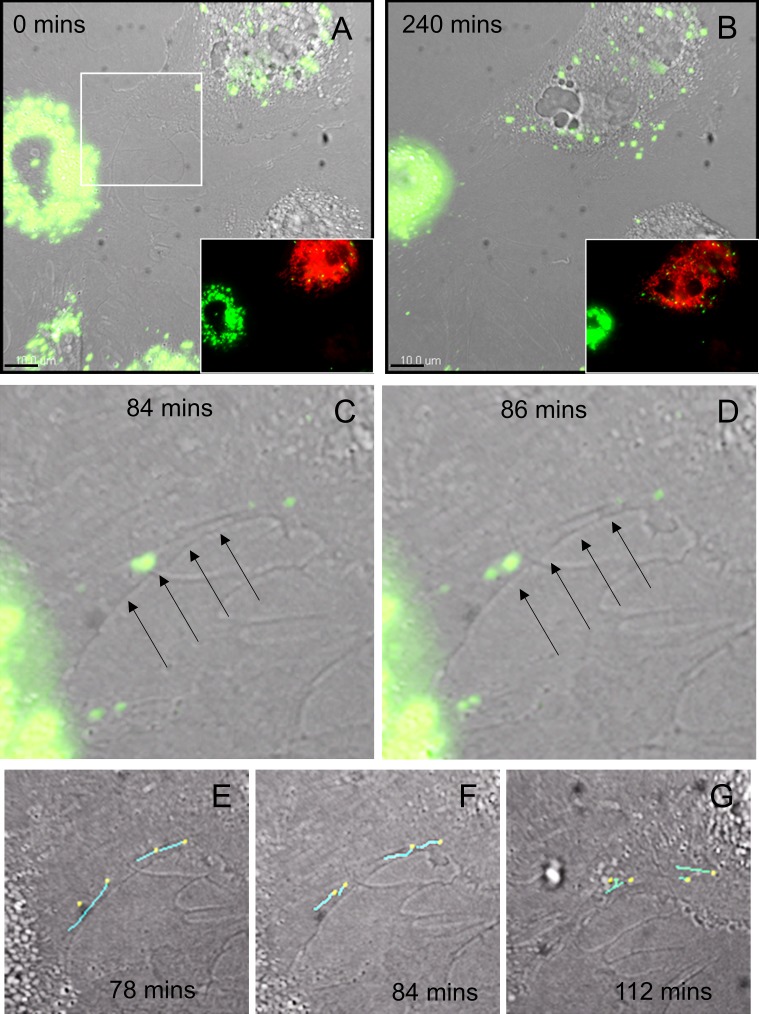
Figure 3.
Still images from movies of live TM cells at 0 minutes (A) and at 240 minutes (B) with the DiO (green) channel overlaid onto a DIC image. The insets show the fluorescence channels to demonstrate that the cell at the top right is labeled with mitochondrial dye (red; Thermo Fisher Scientific). (C, D) The white boxed area in (A) is shown at 84 and 86 mins. A “tube” appears to be formed (arrows) between TM cells and green vesicles are clearly seen in the tubular interior. (E–G) Image analysis software (Bitplane) was used to add “dragon tails” to the vesicles to track their movement. For this, the 488-nm channel was analyzed frame-by-frame and a “dot” was manually placed on a vesicle in each frame. The software added a dragon tail (cyan line) to denote where the vesicles had come from. Dragon tails of 4 vesicles were overlaid onto the DIC images of 78, 84, and 112 minutes. Scale bar: 10 μm.

