Figure 6.
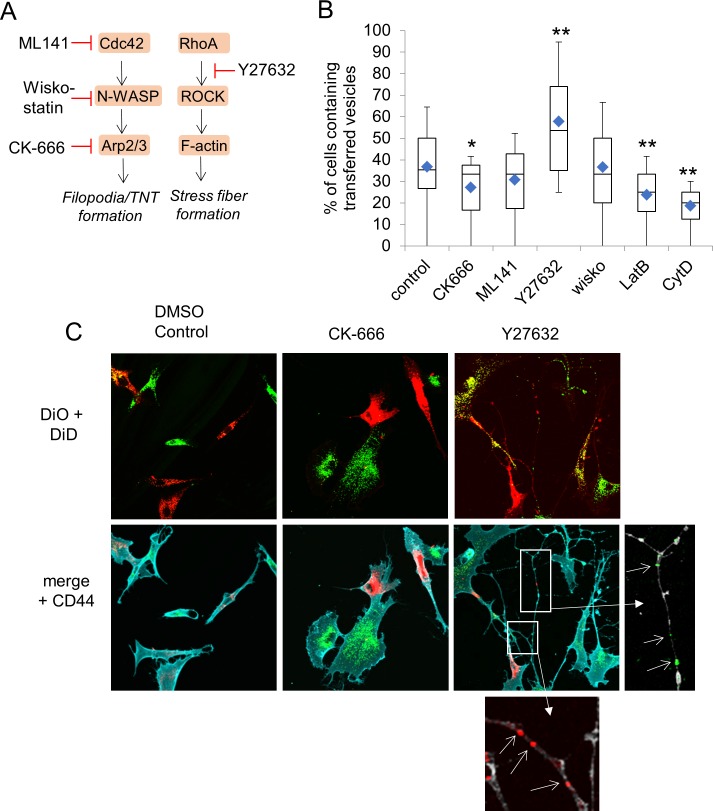
Effect of actin inhibitors on vesicle transfer. (A) Schematic of molecules involved in filopodia and stress fiber formation and their inhibitors. (B) The effects of inhibitors on vesicle transfer between TM cells. The percentage of TM cells containing vesicles of the opposite color were counted in confocal images of control (0.04% DMSO vehicle; n = 58 images; total no. of cells = 294) and TM cells treated with 100 μM CK-666 (n = 53 images; total no. of cells = 284);10 μM ML141 (n = 66 images; total no. of cells = 374); 5 μM Y27632 (n = 35 images; total no. of cells = 163); 10 μM wiskostatin (n = 50 images; total no. of cells = 259); 0.1 μM Latrunculin B (n = 42 images; total no. of cells = 227) and 0.78 μM cytochalasin D (n = 25 images; total no. of cells = 186). The blue diamond in each box is the mean value. Data are from five biological replicates. * P = 0.02 and ** P < 0.002 by ANOVA with Bonferroni correction. (C) Representative confocal images of control, CK-666– and Y27632-treated TM cells labeled with DiD (red); DiO (green); and CD44 (membrane; cyan) used for cell counts. Boxed regions show vesicles in long cell processes in Y27632-treated cells. Here, the CD44 immunostaining was made gray in order to highlight the fluorescently-colored vesicles. Scale bar: 20 μm.

