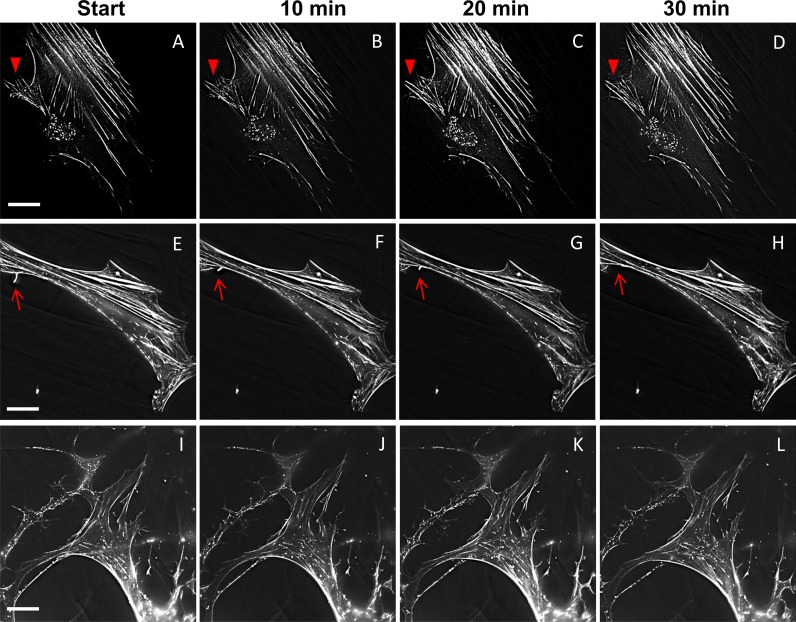
Figure 7.
Actin dynamics in live human TM cells labeled with SiR-actin. Representative images of actin supramolecular structures from time-lapse movies at the start and after 10, 20, and 30 minutes in (A–D) DMSO control; (E–H) CK-666–; and (I–L) Y27632-treated TM cells. Arrowheads (A–D) and arrows (E–H) point to actin in cellular protrusions. Scale bar: 25 μm.

