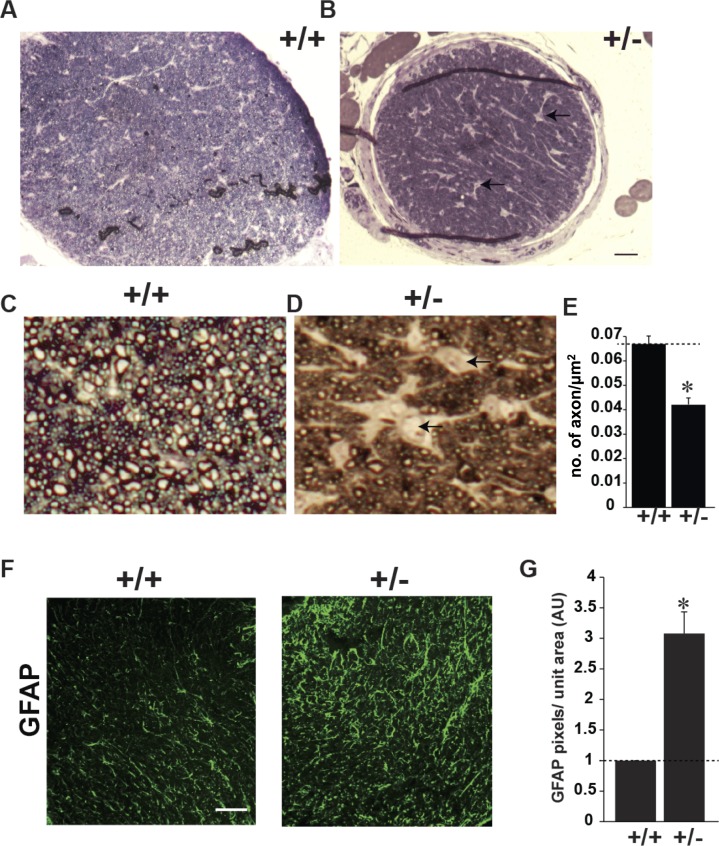
Figure 2.
CASK(+/−) ON display reduced axons and increased astrogliosis. (A, B) Representative images of semithin cross section of optic nerves from indicated genotype stained with toluidine blue. Scale bar: 100 μm. (C, D) Higher magnification of toluidine blue–stained semithin optic nerve sections of indicated genotype. Note that CASK(+/−) optic nerve has lesser axonal density and increased interaxonal space (indicated by arrows). (E) Axonal density from optic nerve of four different mice is quantified, data is plotted as mean ± SEM. (*P < 0.05). (F) Glial fibrillary acidic protein immunolabeling of mutant (+/−) and control (+/+) optic nerves. Scale bar: 50 μm. (G) Quantification of pixels of GFAP per unit area of optic nerve has been plotted as mean ± SEM; n = 4 mice.

