Figure 3.
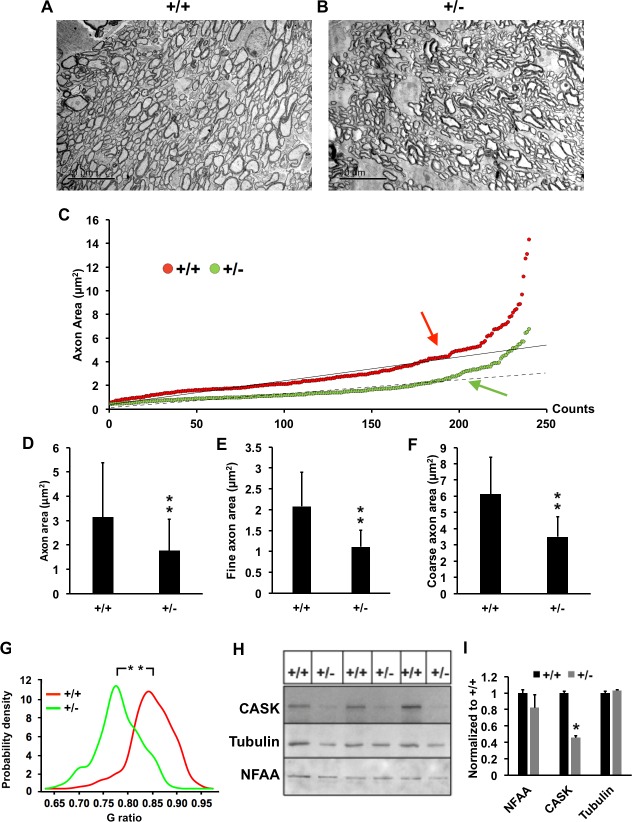
CASK(+/−) ON display axonal thinning. (A, B) Representative transmission electron micrograph of optic nerves from indicated genotypes. (C) Scatter plot of individual axonal areas from control and mutant ON obtained from three mice per genotype. Arrows indicate the “threshold” where the data points start to lose linearity (correlation coefficient R2 value starts and continue decreasing). Axons with area values that are greater than or equal to the threshold are considered as coarse axons, and axons with volume values that are smaller than the threshold are considered as fine axons. Threshold value for (+/+) is 4 and (+/−) is 2 μm2. (D) Mean and SDs of all axons from (C) are plotted, N = 240. (E, F) Comparisons of fine and coarse axons area in mutant (+/−) and control (+/+) ON (n = 3 mice per genotype). Data are plotted as mean ± SD; N = 240. (G) G-ratio probability density distributions of myelinated optic nerve axons of (+/+) and (+/−), N = 240. (H) Immunoblot of optic nerves from six randomly selected animals of indicated genotype. The antigens are indicated, NFAA is neurofilament associated antigen, which is axonal marker. (I) Quantitation of the blots normalized to ponceau staining. Data are relative to wild-type levels and is plotted as mean ± SEM, n = 3 (all panels, *P < 0.05; **P < 0.01).

