. 2017 Sep 25;6:e29839. doi: 10.7554/eLife.29839

Figure 2. Neuronal activity during fictive swimming.

(a) Selected electrophysiological and VSD traces during fictive swimming. Extracellular recording from a nerve root in a posterior segment (DP(13)) showed rhythmic dorsal motor neuron bursts characteristic of swimming (top). Intracellular recording and simultaneous optical signal from an AE neuron show matching membrane potential oscillations. VSD signals from the ventral surface: bilateral cells 153 (a sensory neuron) and the Retzius cell (a neuromodulatory neuron). VSD signals from the dorsal surface: dorsal and ventral inhibitory and excitatory motor neurons DI-1, VI-2, DE-3, and VE-4. (b) Coherence of the optically recorded signals of all cells on the ventral (left) and dorsal (right) surfaces of the ganglion with the swim rhythm. Cells used in (a) are marked. (c) Magnitude (radial axis from 0 to 1) and phase (angular coordinate) of the coherence of each neuron’s activity with the swim rhythm; same data as in (b). Error bars indicate confidence intervals based on a multi-taper estimate. Data available from the Dryad Digital Repository: https://doi.org/10.5061/dryad.m20kh/7 (title: Figure 2, Tomina and Wagenaar, 2017).

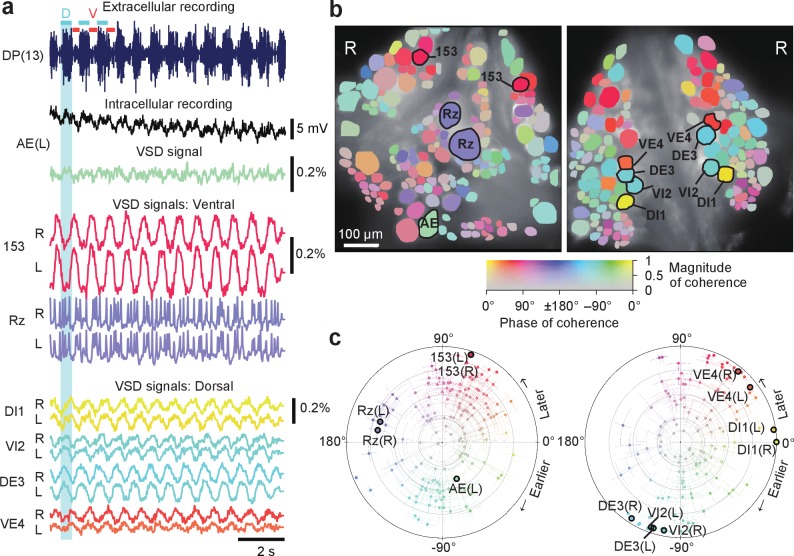
Figure 2.

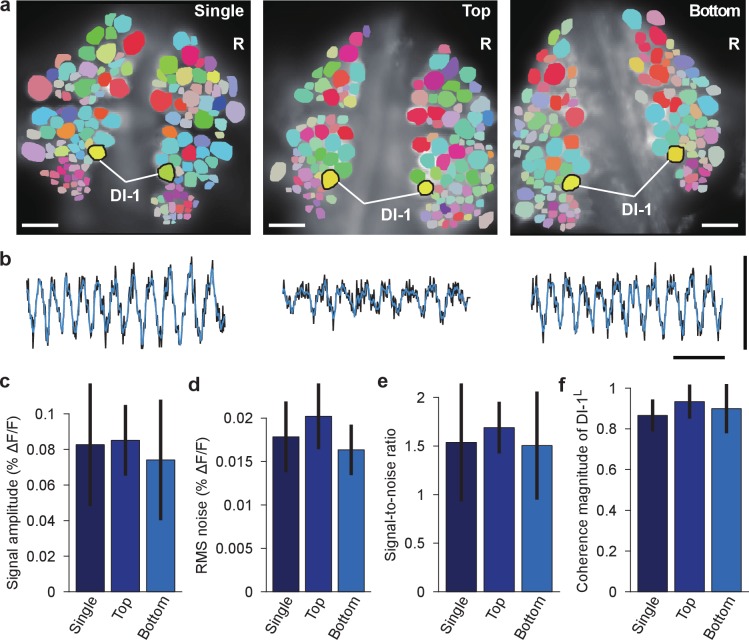
Figure 2—figure supplement 1. Comparison of fictive swimming between single- and double-sided imaging.

Figure 2—figure supplement 1.

(a) Coherence maps for the dorsal side of ganglia during fictive swimming: imaged with a single camera when only the dorsal side was stained (left); imaged with the top camera when both sides were stained (and the ventral side was simultaneously imaged with the bottom camera; center); imaged with the bottom camera when both sides were stained and imaged (right; image reproduced from Figure 2b). Inhibitory motor neuron DI-1R was used as a reference of coherence analysis. Scale bars: 100 μm. (b) VSD signals from DI-1R during the same fictive swimming episodes; imaging conditions as in the corresponding images in (a). Black traces indicate recorded VSD signal, while overlaying blue traces show fitted curve. Scale bars: 2 s for time and 0.2% for ΔF/F. (c) Comparison of fitted peak-to-peak signal amplitude in DI-1R during fictive swimming between the three imaging conditions; mean ±SEM from N = 10 single-sided imaging experiments; six double-sided experiments in which top camera was used to image the dorsal side of the ganglion; and 10 experiments in which the bottom camera was used. (d) Comparison of RMS noise in DI-1R between the three conditions. (e) Signal-to-noise ratio in DI-1R in the three conditions. (f) Magnitude of coherence between DI-1R and DI-1L in the three conditions. In (cf), no significant differences were found between imaging conditions (one-way ANOVAs, all p>0.05; amplitude: p=0.752, RMS noise: p=0.126, signal-to-noise ratio: p=0.777, coherence magnitude: p=0.347). Data available from the Dryad Digital Repository: https://doi.org/10.5061/dryad.m20kh/4 (title: Supplementary, Tomina and Wagenaar, 2017).