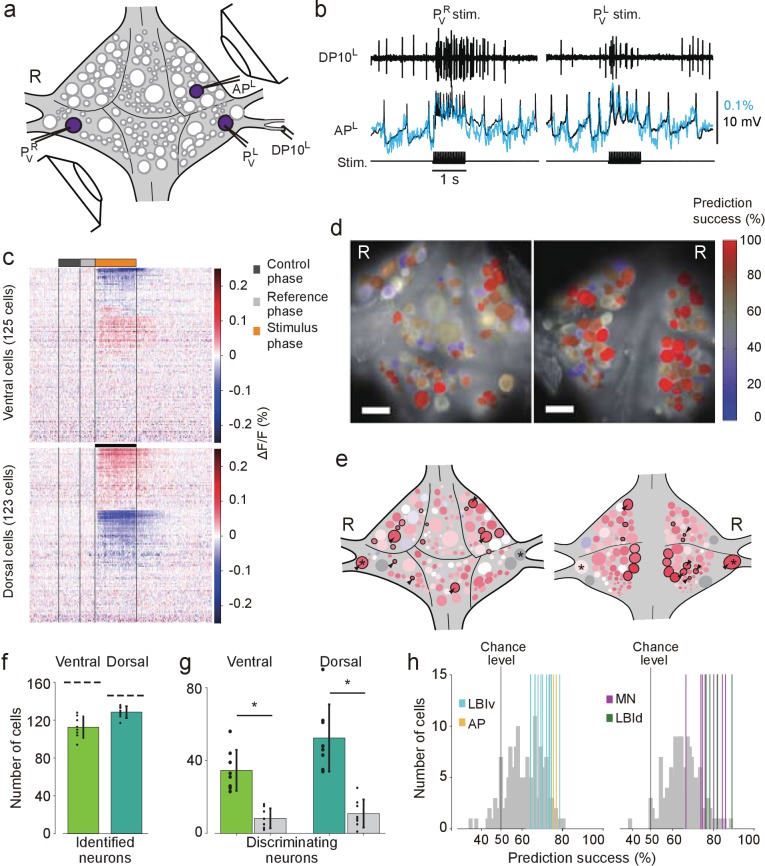
Figure 3. Differential activation during left and right local bend responses.
(a) Schematic of the setup. Microelectrodes were inserted into left and right PV cells for stimulation and into the right AP cell for recording. A suction electrode around the right DP nerve confirmed the execution of a (fictive) local bend. (b) Simultaneously recorded motor activity from the DP nerve (top), membrane potential from the AP neuron (middle, black) and its corresponding VSD trace (blue) in response to stimuli to PVR (left) and PVL (right). Stimulus duration was 1 s (bottom). (c) Time series of averaged difference between PVL (n = 10) and PVR (n = 10) trials in the activity of all 248 recorded cells. Positive (red) indicates more depolarization (or less hyperpolarization) in response to PVL stimulation. Scale bar: 1 s. (d) Stimulus discriminability score overlaid on images of the ventral (left) and dorsal (right) aspects of the ganglion. Scale bars: 100 μm. (e) Averaged discriminability results across eight animals. Color scale as in (d). Motor neurons (MNs) and LBIs are marked (black circles) as are other cells that strongly discriminate between stimuli (≥75% prediction success; circles and arrow heads). *: Leydig cell; see Discussion. (f) Number of cells that could be mapped to identified neurons; mean and SD of 8 preparations and individual results (dots). Dashed lines indicate total number of cells in the canonical maps. (g) Number of cells that strongly discriminate between stimuli (≥75% prediction success) compared to control (grey bars). (*: p<10–4; ventral: p=1.13×10⁻⁵, dorsal: p=4.72×10⁻⁵; Paired sample T-test) (h) Discriminability scores for all neurons on the ventral (left) and dorsal (right) surfaces. 50% prediction success represents a chance level. Colored lines mark the scores of LBIs, AP cells and MNs. Data available from the Dryad Digital Repository: https://doi.org/10.5061/dryad.m20kh/1 (title: Figure 3, Tomina and Wagenaar, 2017).


