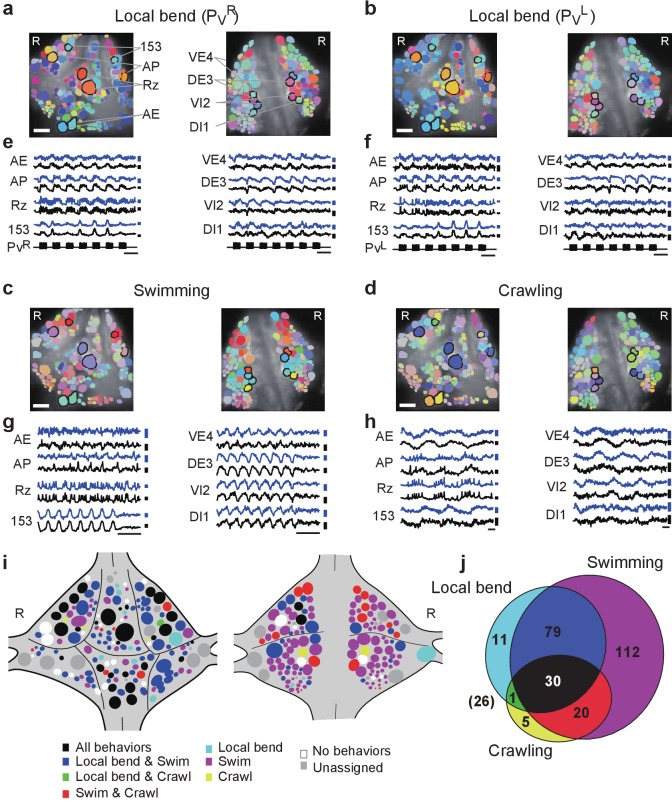
Figure 4. Neuronal activity during multiple behaviors.
(a–d) Coherence of optically recorded signals of all cells on the ventral (left) and dorsal (right) surfaces of a ganglion with (a) PVR-induced local bending, (b) PVL-induced local bending, (c) fictive swimming, and (d) fictive crawling. Color map as in Figure 2b. (e–h) VSD signals of cells indicated in (a–d) during those behaviors. Scale bars: 2 s for time and 0.2% for ΔF/F. Blue and black traces represent the cells on the right and the left sides, respectively. (i) Summary maps of the involvement of identified neurons on the ventral (left) and dorsal (right) surface of the ganglion. Colors indicate which behavior each neuron was involved in. (j) Venn diagram showing the total number of identified neurons that oscillated with each individual behaviors or combinations of behaviors. The number (26) with parentheses outside of the diagram indicates the number of cells determined to be involved in none of the three behaviors. Colors as in (i). Data available from the Dryad Digital Repository: https://doi.org/10.5061/dryad.m20kh/2 (title: Figure 4, Tomina and Wagenaar, 2017).

