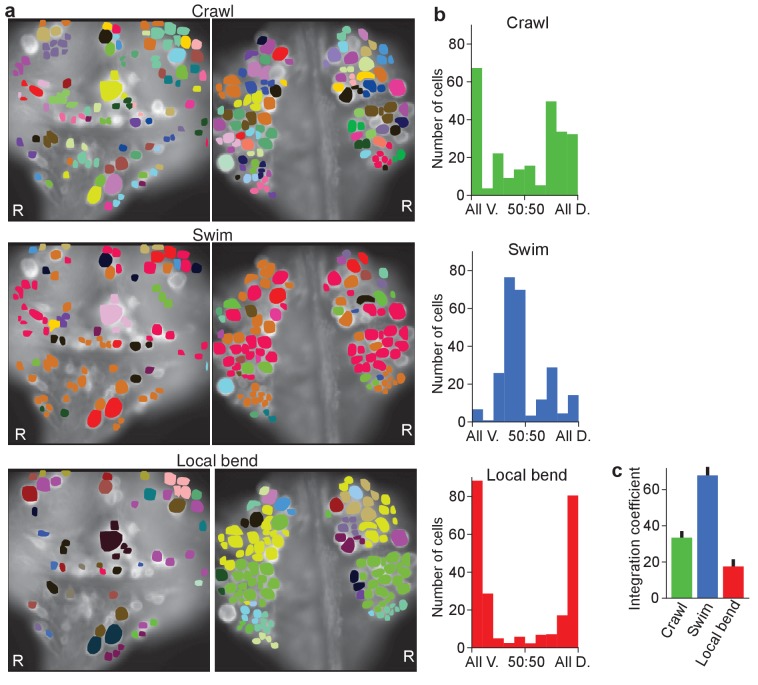
Figure 5. Clustering cells based on their activity in different behaviors.
(a) Cluster assignments of all cells recorded in one animal based on the correlation matrix of their activity during fictive crawling (left), swimming (center), and local bending (right). (b) Degree to which cells within a cluster were fully contained on the ventral side (‘All V.”), fully on the dorsal side (‘All D.”), or equally distributed (‘50:50’). To prevent overrepresentation of small clusters, each cell is an entry in the histogram, not each cluster. Clusters with fewer than three members were excluded. Data from N = 6 leeches. (c) Quantification of the degree to which members of clusters were distributed across surfaces in the three behaviors tested (mean ± SEM, N = 6). All differences were significant (ANOVA, F(2,15) = 63.4, p<10–7, followed by Tukey). Data available from the Dryad Digital Repository: https://doi.org/10.5061/dryad.m20kh/3 (title: Figure 5, Tomina and Wagenaar, 2017).

