. 2017 Sep 8;6:e24502. doi: 10.7554/eLife.24502

Figure 4. Effects of CRISPR activation and inducible knockdown of DYRK1A on PAX6 expression during neural specification by dual SMAD induction.

(A) design of experiment to induce DYRK1A; (B) DYRK1A transcript levels following CRISPR activation in control cells or in presence of ID-8, or compounds 28, 30, or 45. Error bars, SD; **p<0.05. (C) PAX6 transcripts following DYRK1A activation in control cells or cells treated with inhibitors at 50 or 100 nM. Error bars, SD; **p<0.05; all compounds produced significant reductions at all doses at p<0.05. (D) inducible shRNA knockdown of DYRK1A in WA09 hPSC. (E) effect of DYRK1A knockdown on PAX6 transcript levels following dual SMAD induction of neural specification. Result of triplicate experiments shown, mean ±SEM, **p<0.01, ***p<0.001. Studies in A and B were carried out with derivatives of hESC line WA09, those in C and D utilised derivatives of Genea022.

Figure 4.

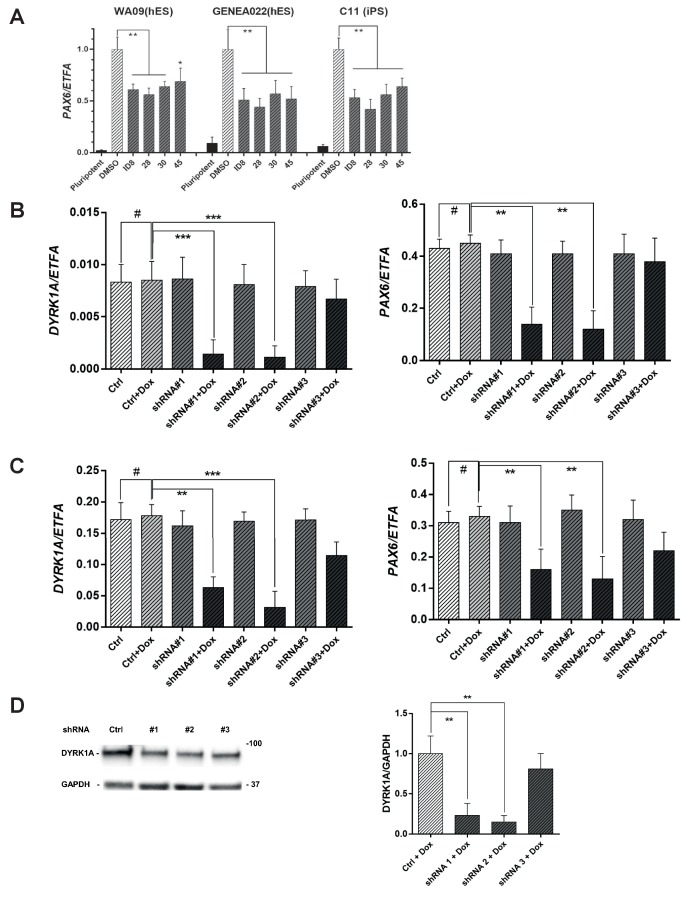
Figure 4—figure supplement 1. Inhibition of PAX6 induction after dual SMAD inhibitor treatment by DYRK1A inhibitors or inducible DYRK1A shRNA in hESC and hiPSC cell lines.

Figure 4—figure supplement 1.

(A) effect of DYRK1A inhibitors on induction of PAX6 expression following dual SMAD induction of neural specification in WA09, GENEA022, and C11 pluripotent stem cells. (B) effect of DYRK1A shRNA treatment on DYRK1A and PAX6 mRNA levels in GENEA022 hESC line; (C) effect of DYRK1A shRNA treatment on DYRK1A and PAX6 mRNA levels in C11 hiPSC line; (D) effect of DYRK1A knockdown on DYRK1A protein levels relative to that of GAPDH showing immunoblot (left) and results of densitometry analysis (right). A, B, and C show transcript levels relative to those of EFTA. *p<0.05; **p<0.01, ***p<0.001, using an unpaired two-tailed t-test with Welch’s correction.