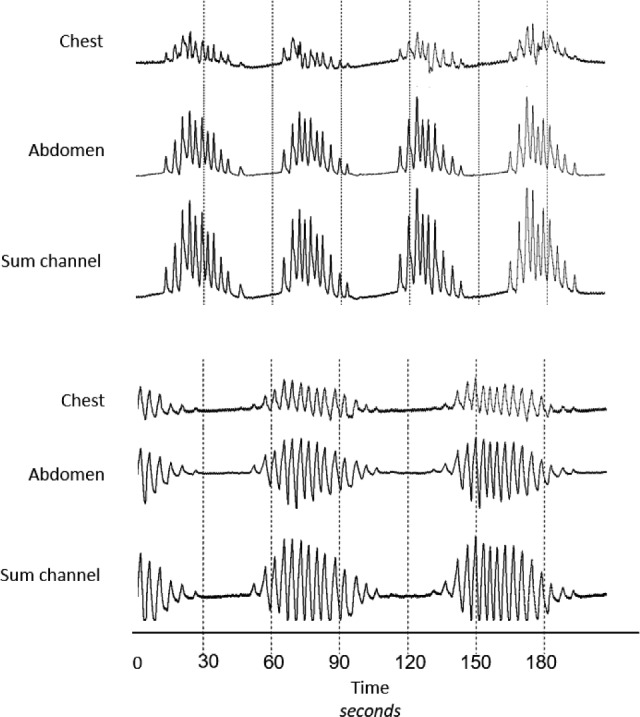
Figure 1. Different patterns of hyperpnea during Cheyne-Stokes respiration.

Raw data tracing of chest, abdomen, and sum channels of the respiratory inductance plethysmograph demonstrating two patterns of hyperpnea during Cheyne-Stokes respiration with central sleep apnea. The upper tracings show a positive pattern in which end-expiratory lung volume remains at or above functional residual capacity, and the lower tracings show a negative pattern in which end-expiratory lung volume falls below functional residual capacity.
