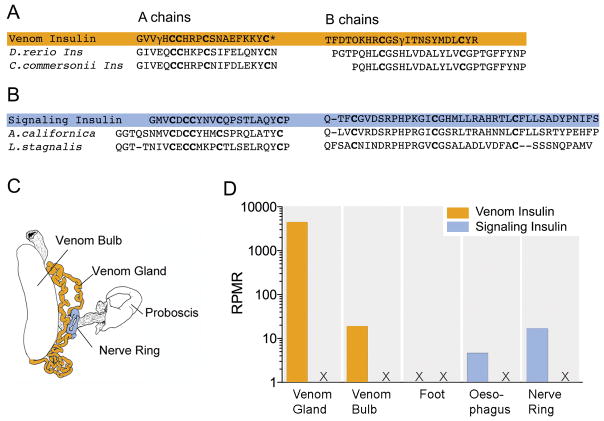
Figure 6.
Similarities in the cysteine arrangement, chain lengths, and amino acid residues between the A and B chains of (A) the venom insulin Con-Ins G1 from Conus geographus and fish insulins from Danio rerio (zebrafish) and Catostomus commersonii (white sucker) and (B) between the cone snail signaling insulin and endogenous insulins from the 2 molluscs Aplysia californica (Californian sea hare) and Lymnea stagnalis (giant pond snail), highlighting that Con-ins G1 specifically evolved to mimic fish insulin in order to efficiently target the metabolism of its fish prey. (C) Anatomical drawing showing the two tissue types with highest expression levels of venom- and signaling insulins in Conus geographus. (D) Venom insulins were most highly expressed in the venom gland whereas signaling insulins were only detected in tissues associated with neuroendocrine function (oesophagus and nerve ring). Numbers represent insulin sequencing reads per million total reads (rprm, log scale). Adapted from (Safavi-Hemami et al. 2016).

