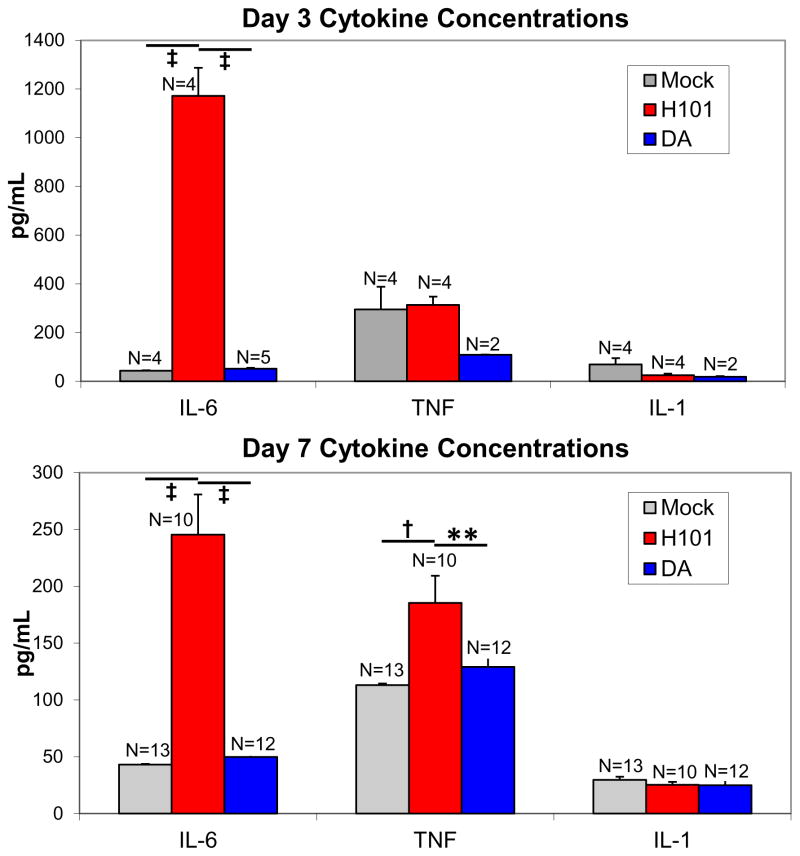
Fig. 2.
Peripheral cytokine levels in mice infected with TMEV-H101, TMEV-DA or mock infected. Mice were infected with 3 × 10⁵ pfu of virus, or injected with PBS, and serum was collected at days 3 and 7 p.i. and assayed for IL-6, TNF and IL-1. **, p<0.01; †, p<0.001; ‡, p<0.0001 (ANOVA, Fisher’s PLSD). Data represents the mean + SEM. The total numbers of mice (N) are shown over the individual bars of the graph

