
Figure 3.
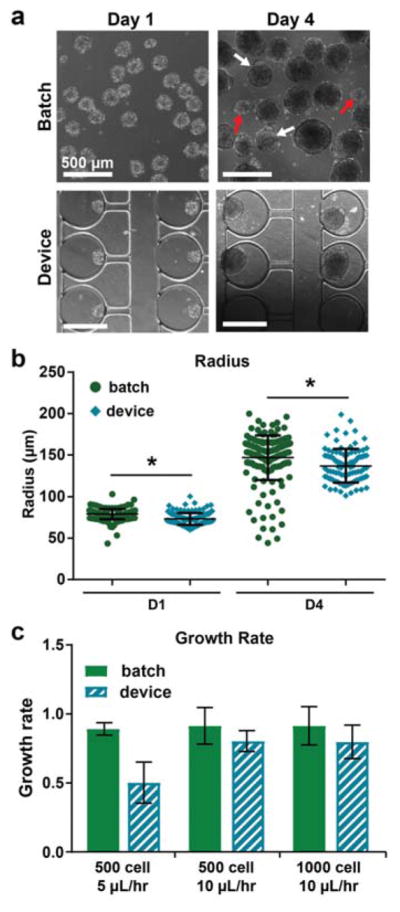
Device culture reduces variability in aggregate size. a) Phase contrast images showing size and morphology at days 1 and 4. Red arrows indicate subpopulations of much smaller aggregates. White arrows indicate aggregates with budding morphologies. b) Aggregate radii were quantified from phase contrast images at day 1 (before loading into devices) and day 4 of differentiation. Two independent samples are shown for each condition, with n ≥ 80 aggregates for batch and n ≥ 40 aggregates for devices. * P < 0.0001. c) Aggregate growth rates for different starting sizes and device perfusion rates. Growth rate was defined as change in size between days 1 and 4, normalized by initial size. n ≥ 2 batch samples or devices, respectively, per condition. All samples: n.s.