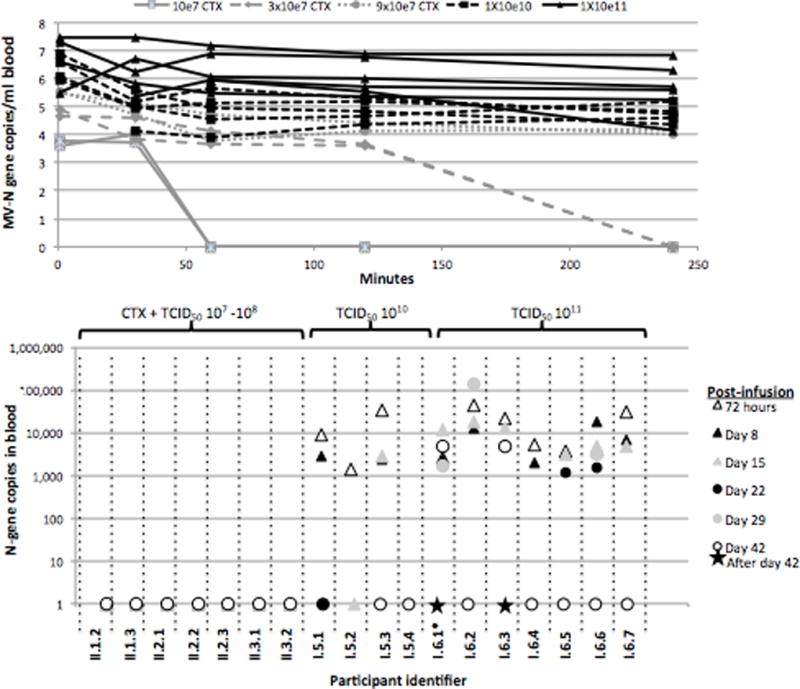
Figure 2.

Summary of pharmacokinetics and correlative studies by dose level. The infusion rate of virus was 100 mL over 30 minutes for all patients through patient I.5.4. For patients I.6.1-I.6.3, the intent was the same, but at this dose of virus, actual infusion rates were 85 minutes, 156 minutes, and 99 minutes respectively due to infusion reactions (see text) requiring halting and resumption of drug. Patient I.6.1 received only 11 mL of drug due to infusion reaction, and was therefore replaced. Thereafter, the protocol was modified to a 250 mL over 2.5 hours in for patients I.6.4-I.6.6. The infusion rate for patient I.6.7 was adjusted to 250 mL over 1 hour.
A. Blood N-gene levels by Q-RT-PCR over first 72 hours by participant
B. Blood N-gene levels by Q-RT-PCR from day 3 post infusion to day 42 by participant
