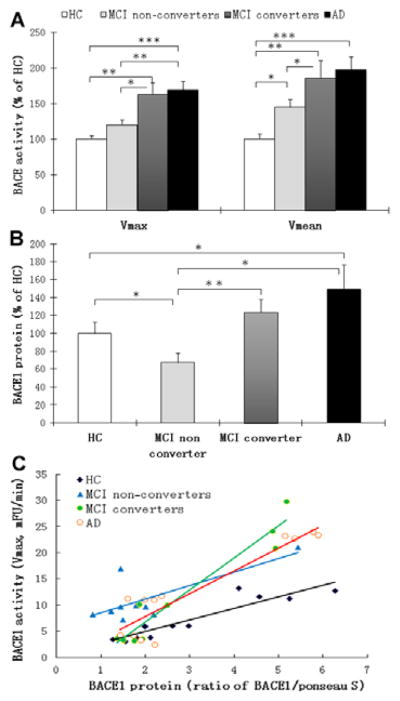
Figure 2.
BACE1 enzymatic activity and protein expression in plasma samples from healthy control (HC) individuals, mild cognitive impaired (MCI) individuals and Alzheimer’s disease (AD) patients. The activity of BACE1 was measured by using synthetic peptide substrates containing the BACE1 cleavage site as we reported 17 with modifications. (A) BACE1 activity as percentage of HC group. The BACE1 activity of plasma samples (both expressed as Vmax or Vmean) exhibited an increase from cognitively HC to MCI non-converters, MCI converters and finally to AD. *P< 0.05, **P< 0.01 and ***P< 0.001 compared to HC, respectively. (B) Density scanning Western blot analysis of BACE1 protein expression in human plasma samples, and bars represent the relative protein expression as percentages of HC (arbitrary unit of BACE1/Ponceau S). (C) Association between plasma BACE1 activity (Vmax, mFU/min) and BACE1 protein expression (Ratio of BACE1/Ponceau S).

