
Figure 2.
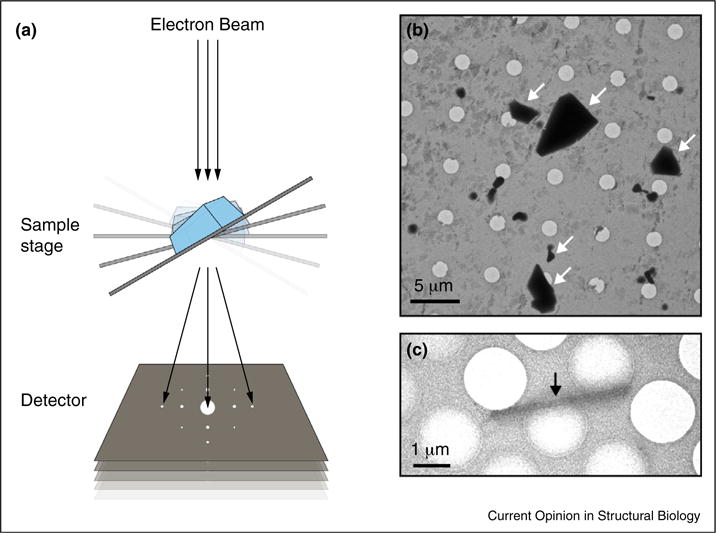
MicroED data collection and microcrystal visualization. (A) Schematic of MicroED data collection by tilting the sample stage between subsequent exposures. Each exposure is of relatively low dose (~0.01 e−/Å2/s) which allows the collection of multiple diffraction patterns from a single crystal that are combined into a single data set. Each data set consists of up to 90 still frames taken at 0.1°–1° intervals. (B,C) Visualizing microcrystals (arrows) in the TEM prior to data collection. The dimensions of microcrystals suitable for MicroED range from approximately 1–10 μm in length and width and 0.1– 1μm in thickness. The crystals of a membrane transporter (B) visualized by negative stain EM, whereas the crystals of a novel designed protein (C) are seen with cryo-EM in over-focused diffraction mode.