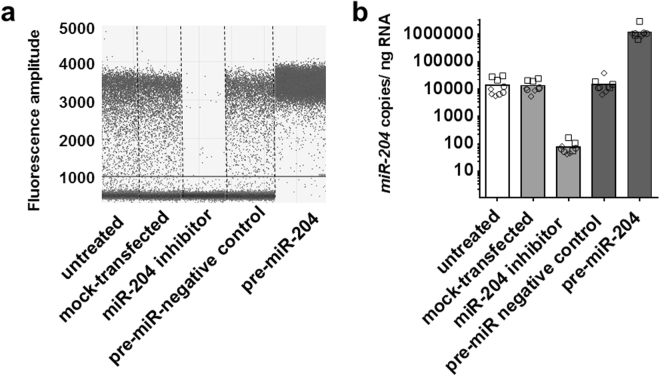
Figure 5.
miR-204 up- and down-regulation in Human Islets. Scatter plot of ddPCR droplets’ fluorescence results from a representative experiment of miR-204 up- or down-regulation in transfected purified human islets. Vertical dotted lines separate treatment groups (panel a). Bar plot of mean miR-204 copies per ng of total RNA measured by ddPCR, according to treatment group. Individual results of 3 transfection replicates are shown for each islet preparation (squares = HP1260, circles = HP1266; diamonds = HP1269). Treatment groups are identified by bar color: untreated cells white bars, miR-204 down-regulation light grey bars, miR-204 up-regulation dark grey bars (panel b).

