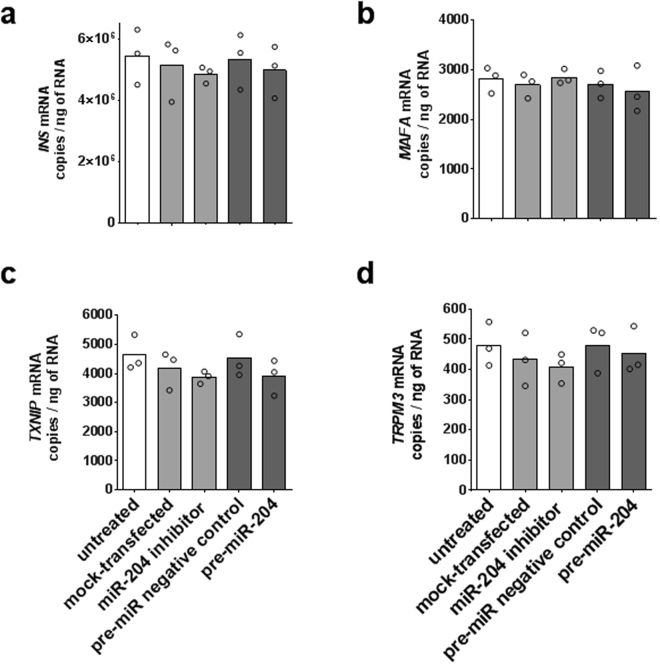
Figure 6.
Effect of miR-204 up- or down-regulation on INS, MAFA, TXNIP, and TRPM3 transcripts in isolated human islets. Bar plots of average copies per ng of total RNA measured by ddPCR for the INS, MAFA, TXNIP, and TRPM3 (panel a,b,c,d, respectively) in miR-204 up- and down-regulation experiments in the HP1260 human islets preparation. Individual results of 3 transfection replicates are shown. Treatment groups are identified by bar color: untreated cells white bars, miR-204 down-regulation light grey bars, miR-204 up-regulation dark grey bars.

