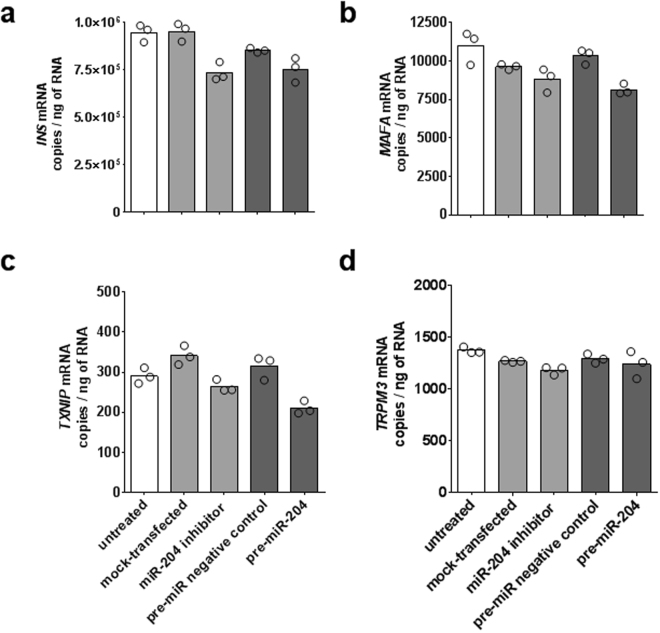
Figure 7.
Effect of miR-204 up- or down-regulation on INS, MAFA, TXNIP, and TRPM3 transcripts in EndoC-βH1. Bar plots of average copies per ng of total RNA measured by ddPCR for the INS, MAFA, TXNIP, and TRPM3 (panels a,b,c,d, respectively) in miR-204 up- and down-regulation experiments. Individual results of each transfection replicate performed in parallel (n = 3) are shown as circles. Treatment groups are identified by bar color: untreated cells white bars, miR-204 down-regulation light grey bars, miR-204 up-regulation dark grey bars.

