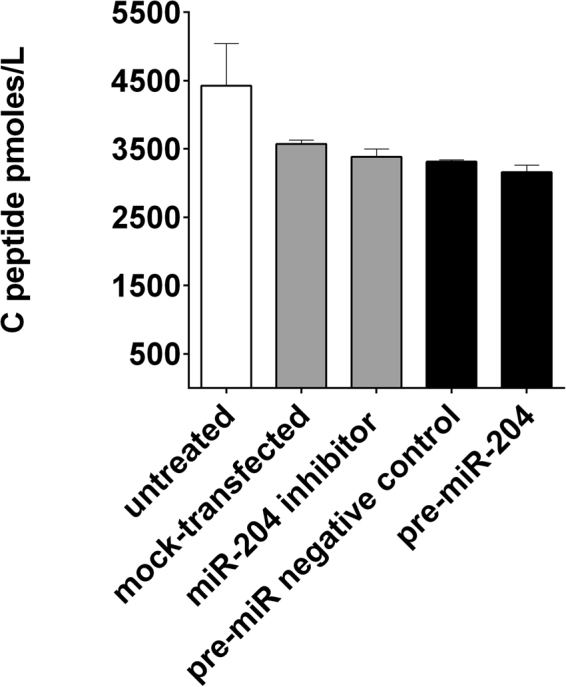
Figure 8.

Effect of miR-204 up- or down-regulation on c-peptide release in EndoC-βH1 supernatants. Bar plot of picomoles/liter of c-peptide in culture supernatant measured by ELISA at day 1 after miR-204 up- and down-regulation. Results are shown as mean + SD of two technical replicates. Treatment groups are identified by bar color: untreated cells white bars, miR-204 down-regulation light grey bars, miR-204 up-regulation dark grey bars.
