Figure 5.
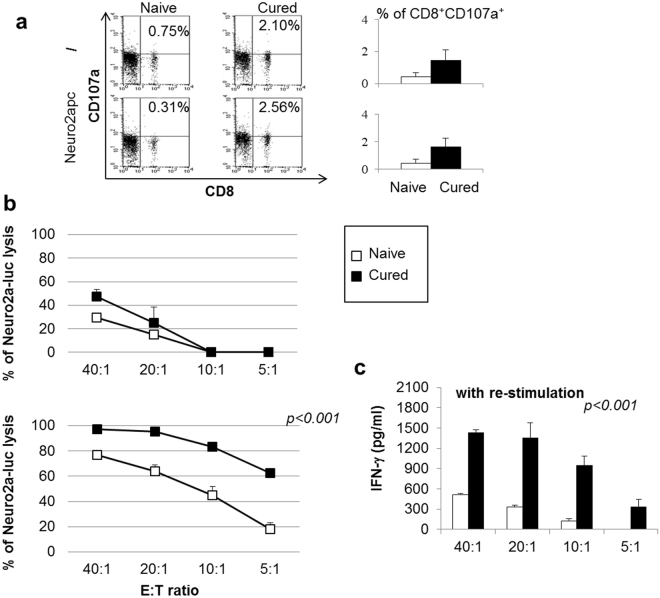
Spleen cells from mice cured by combination therapy with anti-PD-1 and anti-CD4 mAb display CTL responses in vitro.(a) Spleen cells from mice treated by combined anti-PD-1/anti-CD4 mAb therapy show higher frequency of CD8+CD107a+ CTLs relative to naïve mice. CD8+CD107a+ slightly increased after in vitro re-stimulation with Neuro2apc cells. Percentages of double positive cells are given. (left panel: a representative mouse is shown, right panel: M ± SD values of CD8+CD107a+ T cells from 5 mice per group are given. (b) Cytolytic activity of spleen cells from naïve (open boxes) and cured mice (full boxes) against Neuro2a-luc cells, at different Effector:Target (E:T) ratios (upper panel). Cytolytic activity of spleen cells from naïve (open boxes) and cured mice (full boxes), after 5-day in vitro MLTC stimulation with Neuro2apc cells, against Neuro2a-luc cells, at different E:T ratios (lower panel). Percentages are evaluated as indicated in the material and method section. P values are indicated (T-test). (c) IFN-γ production of MLTC stimulated spleen cells from naïve (open histogram) and mice cured by combined anti-PD-1/anti-CD4 mAb therapy (black histogram) after further 72 hrs stimulation with Neuro2a-luc cells, at different E:T ratios. P values are indicated (T-test).

