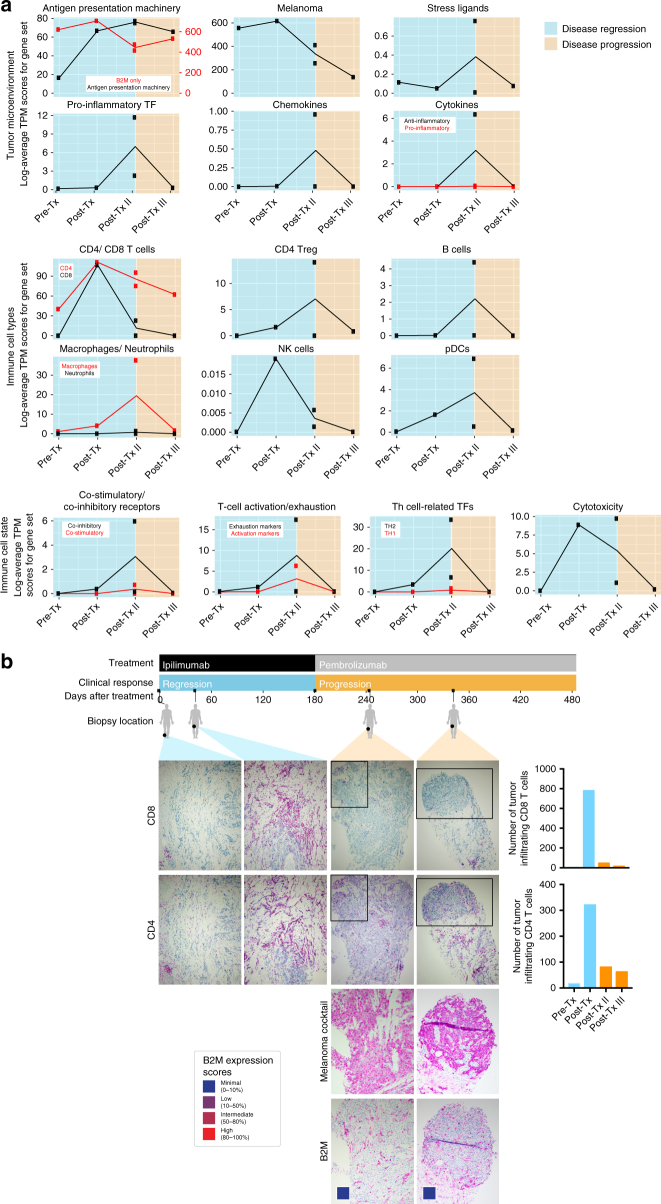
Fig. 2.
Dissecting the tumor microenvironment during disease regression and progression. a Expression scores of genes related to the tumor microenvironment, immune cell types, or immune cell states. Expression scores were calculated as the geometric mean of TPM values of genes in Supplementary Data 3. Blue backgrounds indicate biopsies taken during disease regression, and orange backgrounds indicate biopsies taken during disease progression. b Samples for each time point from Pat208 were stained with specific antibodies against CD8 or CD4 and were quantified using the cell counter function in Fiji (described in “Methods” section). Boxes areas in the upper panels (CD4 and CD8, original magnification ×100) are shown at higher magnification (×200) in the lower panels (melanoma cocktail and B2M). Colored boxes indicate B2M expression scores: B2M scoring was estimated by using four different levels of expression in the tumor fraction: minimal, 0–10%; low, 10–50%; intermediate, 50–80%; and high, 80–100%, B2M expression in the tumor fraction. A timeline of treatment, clinical response, and biopsy locations is shown at the top

