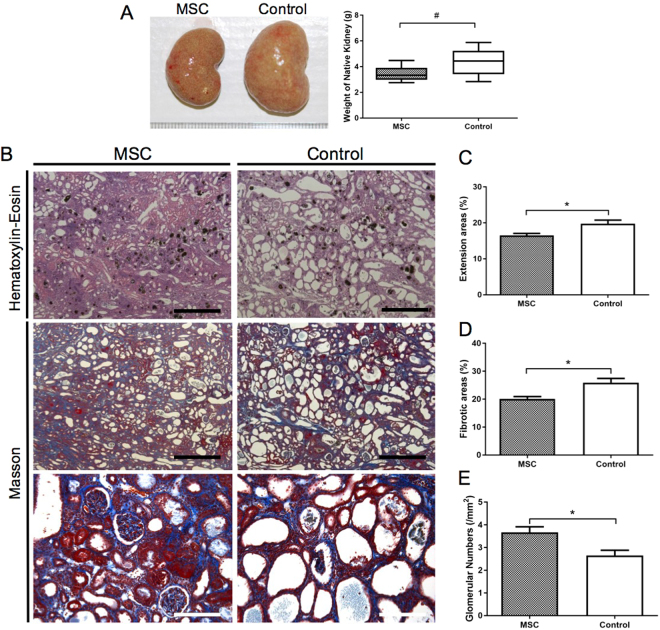
Figure 1.
Histopathology of the kidneys in adenine-fed rats. (A) The average kidney weight in the control group was higher than that in the MSC group (P < 0.005). (B–E) Histopathological analysis of kidneys by haematoxylin–eosin staining and Masson-trichrome staining. Distention of tubular lumens (P < 0.01), interstitial fibrosis (P < 0.005), and reduction in glomerular numbers (P < 0.005) were observed in the control group as compared to those parameters in the MSC group. Data are expressed as the mean ± SEM. Black scale bars: 500 μm, white scale bars: 100 μm.

