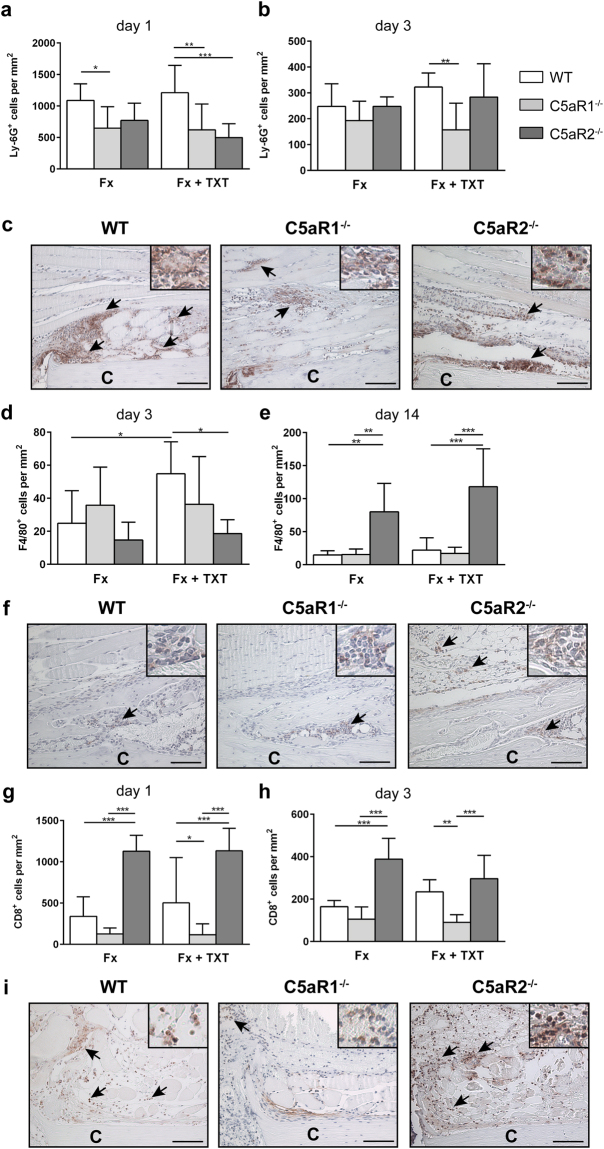
Figure 3.
Quantification and representative immunohistological staining of immune cells in the fracture haematoma/callus. Quantitative analysis of Ly-6G+ neutrophils in the fracture haematoma 1 (a) and 3 (b) days after trauma calculated in the periosteal area between the two inner pins of the external fixator. Representative neutrophil staining at day 1 (c). Quantitative analysis of F4/80+ macrophages in the fracture haematoma and callus calculated either in the endosteal area in direct proximity to the fracture gap 3 days after trauma (d) or in the periosteal callus 14 days after trauma (e). Representative macrophage staining at day 14 (f). Quantitative analysis of CD8+ cells in the fracture haematoma 1 (g) and 3 (h) days after trauma calculated in the periosteal area between the two inner pins of the external fixator. Representative staining of T-cells at day 1 (i). Fx: mice with isolated fracture, Fx + TXT: mice with combined fracture and thoracic trauma. n = 6, scale bar 100 µm. *p < 0.05, **p < 0.01, ***p < 0.001.

