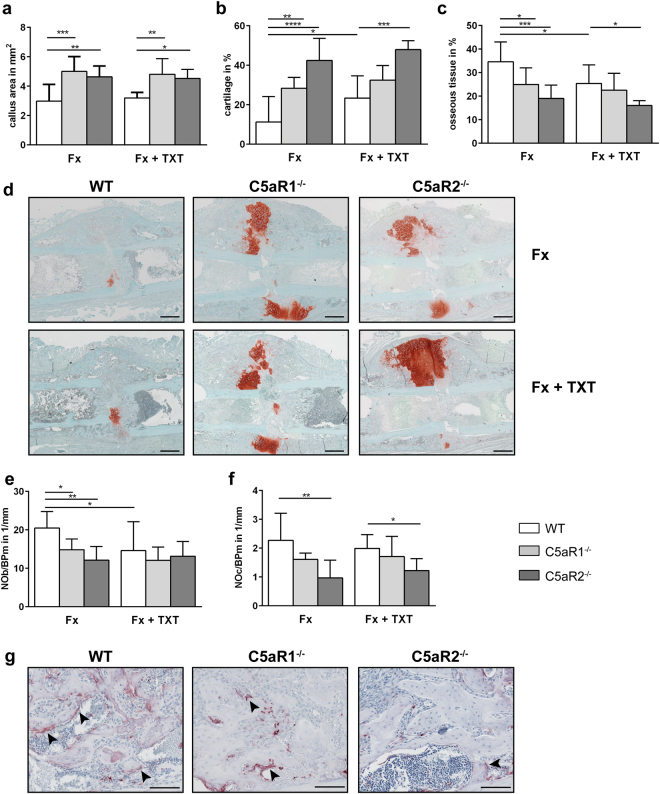
Figure 4.
Analysis of fracture healing 14 days after trauma. Areas of different tissues as determined by Safranin O staining: total callus area (a), relative cartilage content (b) and osseous tissue content (c). Representative images of Safranin O-stained femurs at day 14 (d). Scale bar 500 µm. Relative numbers of osteoblasts (e) and osteoclasts (f) in the periosteal fracture callus. Representative images of TRAP staining at day 14 (g). Scale bar 100 µm. Fx: mice with isolated fracture, Fx + TXT: mice with combined fracture and thoracic trauma. n = 5–6, *p < 0.05, **p < 0.01, ***p < 0.001.

