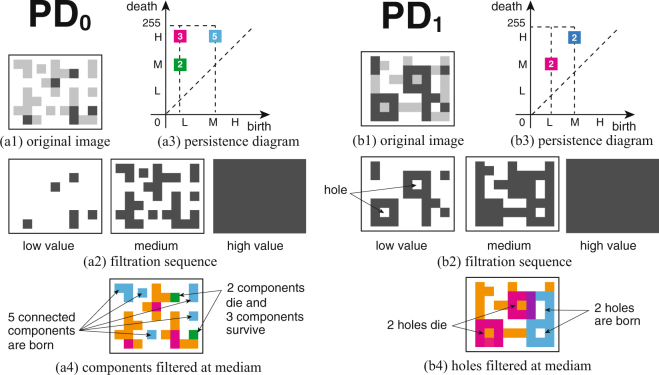
Figure 1.
Conceptual schema of the filtration and persistence diagram for pixel image data. For simplicity we assume that there are only 3 grayscale levels, namely, black (low, L), gray (medium, M), and white (high, H), respectively. The figures show the case of zeroth and first persistence diagram (PD0 and PD1) for connected components and holes, respectively. We generate the filtration sequences (a2 and b2) of the images by increasing the grayscale threshold from a low to high value, corresponding to from the original image of (a1 and b1) to the background. The persistence diagrams of (a3) and (b3) are obtained by plotting the locations of the persistent Betti numbers as a point . The white numbers on each square indicate the multiplicities at each point (i, j). (a4 and b4) Schematic image of the colored blocks which generate the associated persistent Betti numbers on the persistence diagrams PDp at the medium level. The details are given in Methods.

