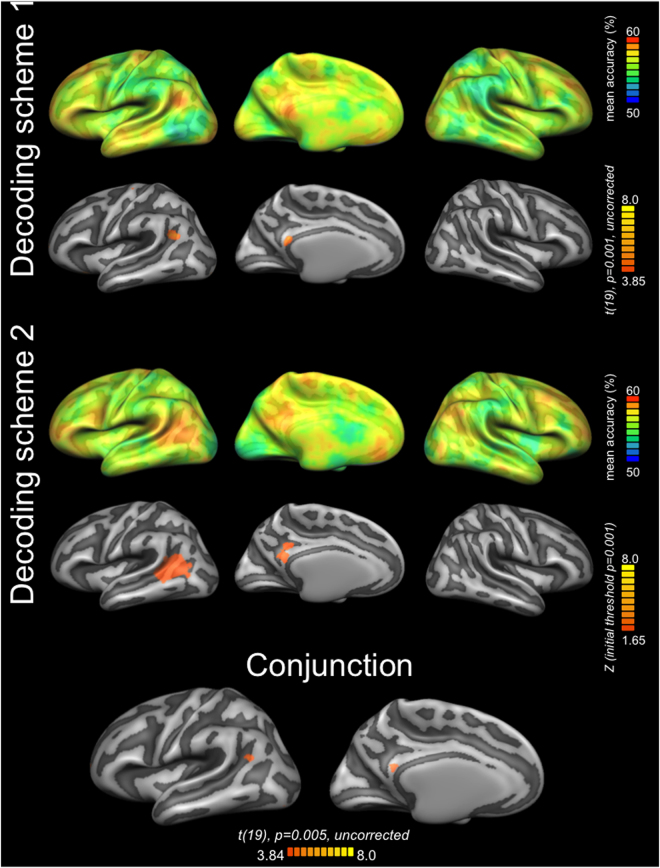
Figure 2.
Brain network for the human-nonhuman distinction. For each decoding scheme, the upper row shows the mean accuracy map obtained from individual accuracy maps, cortex-based aligned, averaged, and projected onto a common group surface (decoding accuracy at chance is 50%). For each decoding scheme, the lower row shows the statistical map obtained by entering the individual maps into a one-sample t tests. The conjunction of the two statistical maps shows the brain structures with above-chance classification accuracy for both schemes. Decoding scheme 1: training on man versus chicken, test on baby versus cat, and vice versa; Decoding scheme 2: training on man versus cat, test on baby versus chicken, and vice versa. Lateral views of the left and right hemisphere are shown in the first and third column respectively; ventral sagittal view of the left hemisphere is shown in the medial column.

