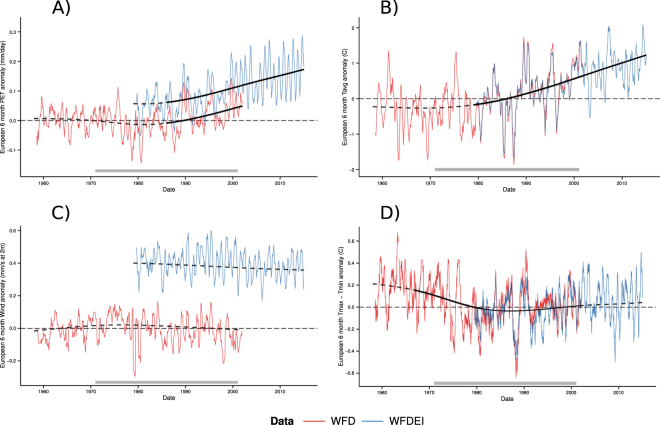
Figure 3.
Mean six month seasonal anomaly averaged across Europe for reference evapotranspiration (A) and its constituents: (B) daily T Mean, (C) wind speed, and (D) T Max − T Min. Historical data are shown in red (WFD) and blue (WFDEI). No bias correction is included to highlight differences between WFD and WFDEI. Long term trends are shown as a dotted line, with significant trends as a solid, black overlay. A grey bar at the bottom shows the reference period.

