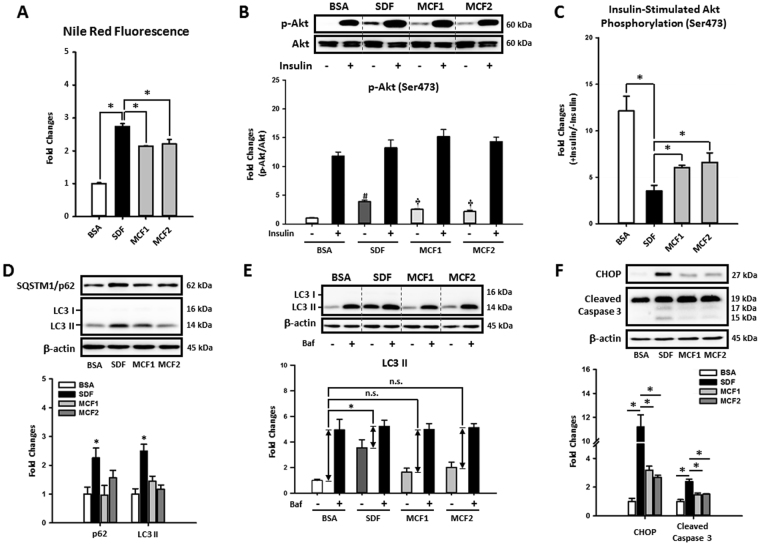
Figure 3.
Increasing MCFA ratio attenuated LCFAs-induced fat accumulation, insulin resistance, autophagy impairment, ER stress, and apoptosis in HepG2 cells. To investigate whether MCFAs can directly exert their protective effects in hepatic cells, the fat accumulation, insulin resistance, autophagy impairment, ER stress, and apoptosis were evaluated in fat-loaded HepG2 cells. For intracellular lipid quantification, 48-hour fat-loaded cells were fixed then stained with Nile Red and Hoechst 33342 (A). For the insulin sensitivity test, cells were incubated with 100 nM insulin for an additional 10 min after a 48-hour fatty acid treatment. Representative immunoblots and densitometric quantification of phospho-Akt (Ser473) (B), and the calculated insulin-stimulated Akt phosphorylation fold change results (C) are presented. Representative SQSTM1/p62 and LC3 immunoblots and densitometric results show that increasing MCFA/LCFA ratio protected HepG2 cells against LCFA-induced autophagy impairment (D). Autophagic flux changes were also confirmed by analyzing Bafilomycin A1 (50 nM, 3 hours)-induced LC3 II protein accumulation in BSA or fatty acid-treated HepG2 cells (E). Western blotting results of CHOP and cleaved caspase 3 show that MCFAs also attenuated LCFAs-induced ER stress and apoptosis in HepG2 cells (F). For densitometric analyses of Western blotting data, β-actin or total Akt (for Akt phosphorylation analysis) were used as the loading control. Values are mean ± SEM (n = 3). *, #(vs. BSA treated cells without insulin stimulation), and †(vs. SDF-treated cells without insulin stimulation) indicate statistical significance, P < 0.05. n.s.: no significant difference. SDF: standard fat loading mixture (0.4 mM PA + 0.4 mM OA); MCF1: MCFA-containing fat mixture 1 (0.4 mM PA + 0.2 mM OA + 0.2 mM CA); MCF2: MCFA-containing fat mixture 2 (0.4 mM PA + 0.2 mM OA + 0.2 mM LA); Baf: Bafilomycin A1. Full-length blots are presented in Supplementary Figure S3.

