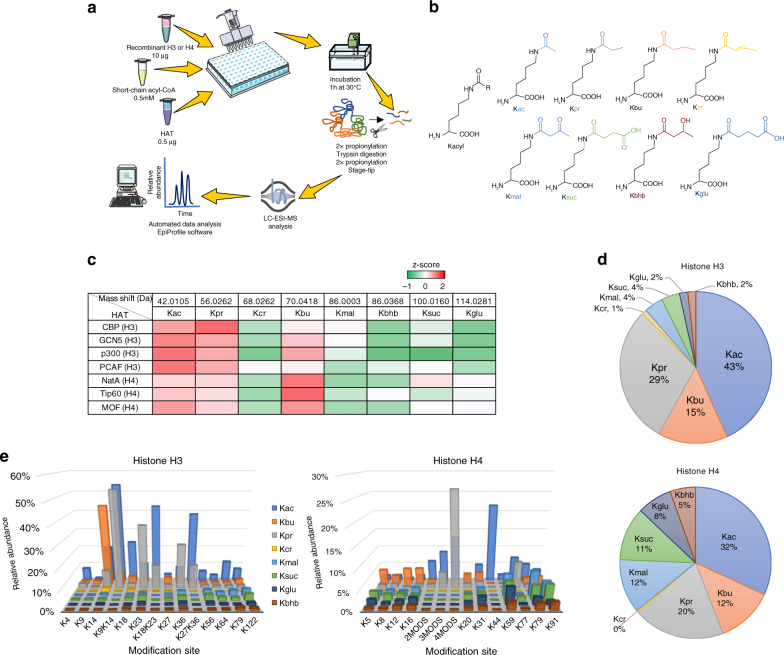
Fig. 1.
Overview of histone acetyltransferases (HATs) in vitro acylation activity and specificity. a Schematic representation of in vitro acylation assay. b Chemical structures of histone acyl modifications evaluated in this study. Lysine modifications and abbreviations are: acetyl (Kac), propionyl (Kpr), butyryl (Kbu), crotonyl (Kcr), malonyl (Kmal), succinyl (Ksuc), β-hydroxybutyryl (Kbhb), and glutaryl (Kglu). c Heat map displaying the in vitro acylation activity profiles of different HATs in the presence of acetyl-, propionyl-, crotonyl-, butyryl-, malonyl-, β-hydroxybutyryl-, succinyl- and glutaryl-CoA. Molecular mass shift of the various acylated lysines residues are shown in the table headers. Different HATs were assayed against histones H3 or H4 as specified in the first column. To generate the heat map, we averaged the relative abundance of acyl-PTMs on the quantified peptides and then normalized (z-scores) those values across the different HATs, i.e. row normalization. d Pie chart showing the average relative frequency of in vitro acylated peptides, divided in results for histone H3 (top) and histone H4 (bottom). e Bar plots depict the specificity for all HATs on the histone sequence. The x axis represents the modification site at histones H3 (left) and histone H4 (right), and the y axis represents the relative abundance shown as the average contribution of HATs to all acylated peptides. For histone H4 N-terminal peptide (G4-R17), the number of acylations on the sequence are displayed using the code 2, 3 or 4 mods. This is because it was not always possible to discriminate modification sites on the multiply modified H4 peptide. All values shown were corrected by the contribution of non-enzymatic acylation. All results are shown as the average of 3 independent experiments

