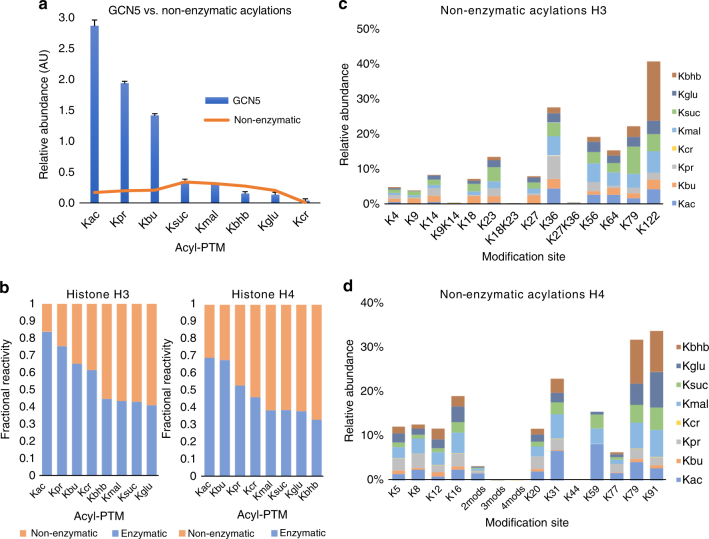
Fig. 2.
Non-enzymatic versus enzymatic acylation of histones in vitro. a Comparison of non-enzymatic versus GCN5-catalyzed acylations on histone H3. The y axis (arbitrary units) represents the sum of the relative abundances of all enzymatically and non-enzymatically acylated peptides from histones H3. We can observe that the contributions for Ksuc, Kmal, Kbhb, Kglu and Kcr in the experiments with GCN5 were mostly the result of non-enzymatic acylations. b Stacked column representation of non-enzymatic reactivity divided by enzymatic reactivity of the eight acyl-CoA donors on histone H3 (left) and histone H4 (right). The fractional reactivity represents the ratio of PTM intensity in presence of all seven enzymes tested versus PTM intensity in absence of enzymes, i.e., 0.5 corresponds to identical intensities with and without enzyme. For instance, crotonylation is an overall low abundance PTM, although the majority detected on histone peptides is the result of an enzymatic catalysis. c, d Bar plot showing the relative quantitation of non-enzymatically acylated sites on c histones H3 and d histone H4. All results are shown as the average of three independent experiments and error bars represent the S.D.

