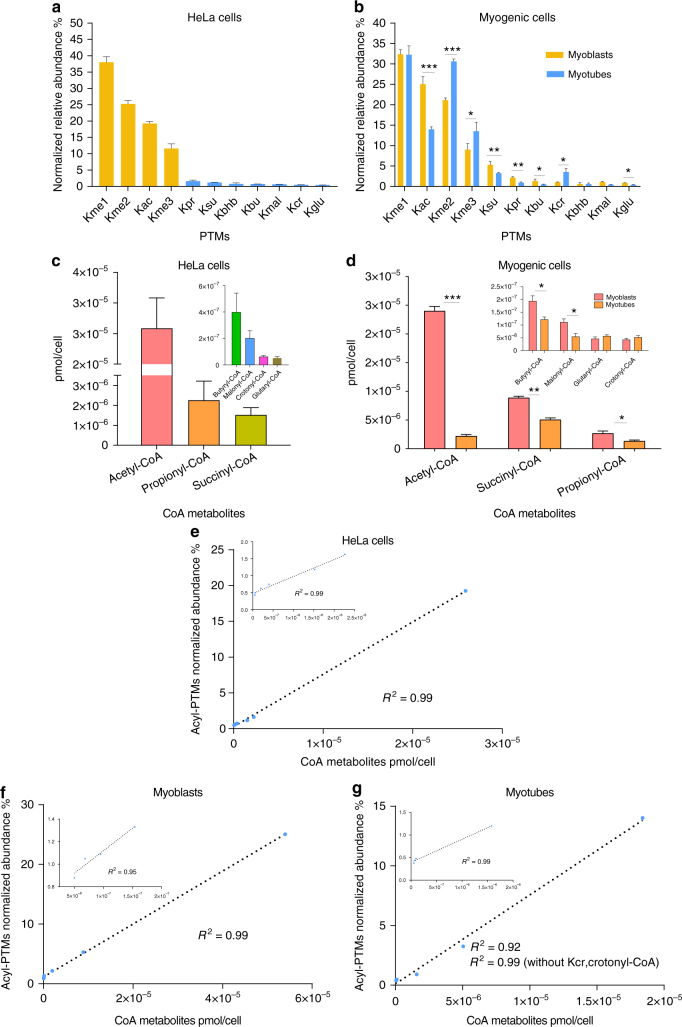
Fig. 4.
Overview of the relative abundances of endogenous acyl-PTMs and intracellular metabolite concentrations. Bar plots showing the relative abundances of several lysine PTMs in a HeLa cells, b proliferative myogenic cells (myoblasts) and differentiated myogenic cells (myotubes). PTMs are shown as percentages representing the normalized relative abundances of all detectable peptides of canonical histones H3 and H4. c, d Bar plots showing the concentrations of acyl-CoA metabolites in c HeLa cells and d myogenic cells normalized to cell number. Metabolic concentrations of butyryl-CoA may also represent concentrations for isobutyryl-CoA. e–g Global histone acylation levels correlation with intracellular concentrations of acyl-CoA metabolic intermediates in e HeLa cells, f myoblasts and g myotubes. Correlations are calculated between the normalized net abundances of all detectable acylated peptides in H3 and H4 and the global concentrations CoA metabolites in pmol per cell. Insets show zoom in graphs with the linear correlation of the data without the values for acetyl-CoA and Kac. All results are shown as the average of three biological replicates and error bars represent the S.D. Summary of p-values is as follows; *p ≤ 0.05, **p ≤ 0.01, and ***p ≤ 0.001. p-values were generated by unpaired Student’s t-test

