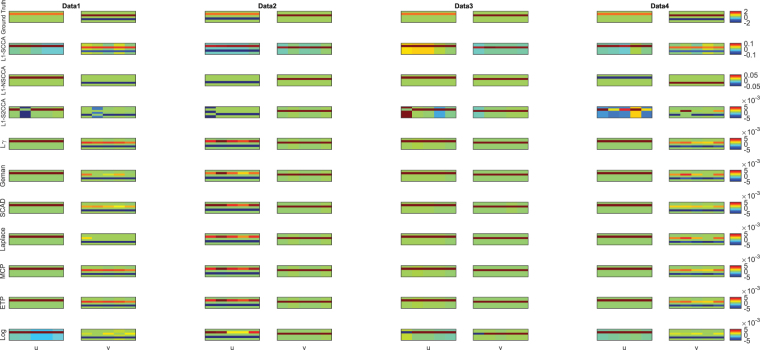
Figure 2.
Canonical loadings estimated on four synthetic data sets. The first column shows results for Data1, and the second column is for Data2, and so forth. The first row is the ground truth, and each remaining one corresponds to an SCCA method: (1) Ground Truth. (2) L1-SCCA. (3) L1-NSCCA. (4) L1-S2CCA. (5) -norm and so forth. For each data set and each method, the estimated weights of u is shown on the left panel, and v is on the right. In each individual heat map, the x-axis indicates the indices of elements in u or v; the y-axis indicates the indices of the cross-validation folds.

