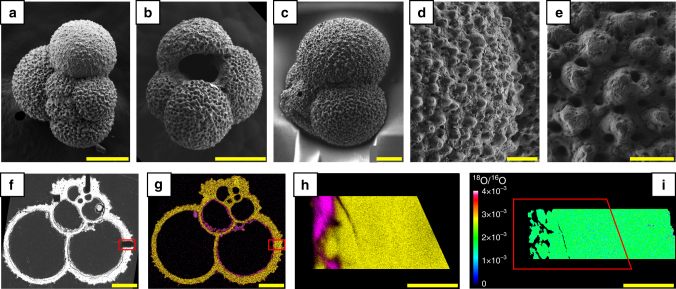
Fig. 1.
Foraminifera tests prior to isotope re-equilibration experiments. a–e SEM images showing the overall morphologies and ultrastructures of the foraminifera tests (G. bulloides) after their ultrasonic cleaning in pure ethanol. f Backscattered SEM image of a polished section of a test embedded in epoxy. g, h Energy dispersive X-ray spectroscopy (EDXS) maps showing the spatial distributions of carbonates (Ca appears in yellow) and clays (Si appears in pink). i NanoSIMS map displaying the isotopically homogeneous nature of the carbonates and clays (18O/16O = 0.002). The red rectangles in f, g indicate the locations of i. The red rectangle in i indicates the location of h. Scale bars are 100 µm (a, b, f, g), 50 µm (c), 20 µm (d, i) and 10 µm (e, h)

