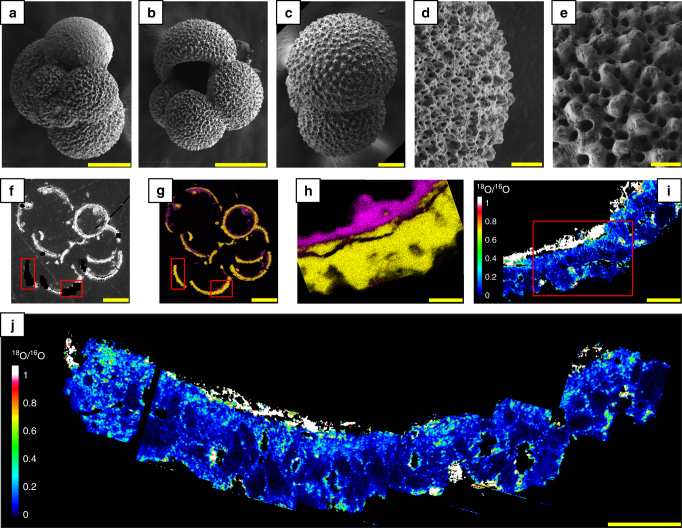
Fig. 2.
Foraminifera tests after isotope re-equilibration experiments. a–e SEM images showing the overall morphologies and ultrastructures of the foraminifera tests (G. bulloides) after their ultrasonic cleaning in pure ethanol. f Backscattered SEM image of a polished section of a test embedded in epoxy. g, h EDXS maps showing the spatial distributions of carbonates (Ca appears in yellow) and clays (Si appears in pink). i, j NanoSIMS maps showing the 18O/16O ratio distributions in carbonates and clays. Carbonates exhibit a 18O/16O ratio ranging from 0.1 to 0.8, while clays exhibit a 18O/16O ratio ranging from 0.9 to greater than 1.0. Note that the isotope exchange occurred very heterogeneously, leading to areas that are more or less enriched in 18O. The red rectangles in f, g indicate the locations of i, j. The red rectangle in i indicates the location of h. Scale bars are 100 µm (a, b, f, g), 50 µm (c), 20 µm (d, i) and 10 µm (e, h, j)

