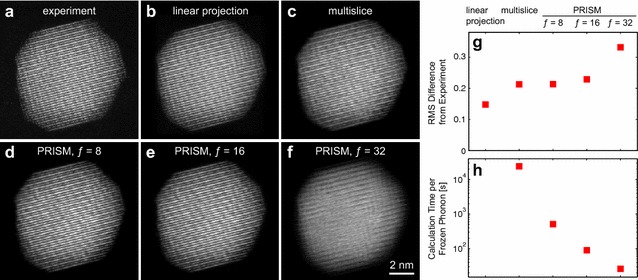
Fig. 8.

Images from one projection of an atomic electron tomography tilt series of a FePt nanoparticle [14], from a experiment, b linear projection of the reconstruction, c multislice simulation, and d–f PRISM simulations for , 16, and 32, respectively. g Relative root-mean-square error of the images in (b–f) relative to (a). h Calculation times per frozen phonon configuration for (c–f). All simulations performed with Prismatic
