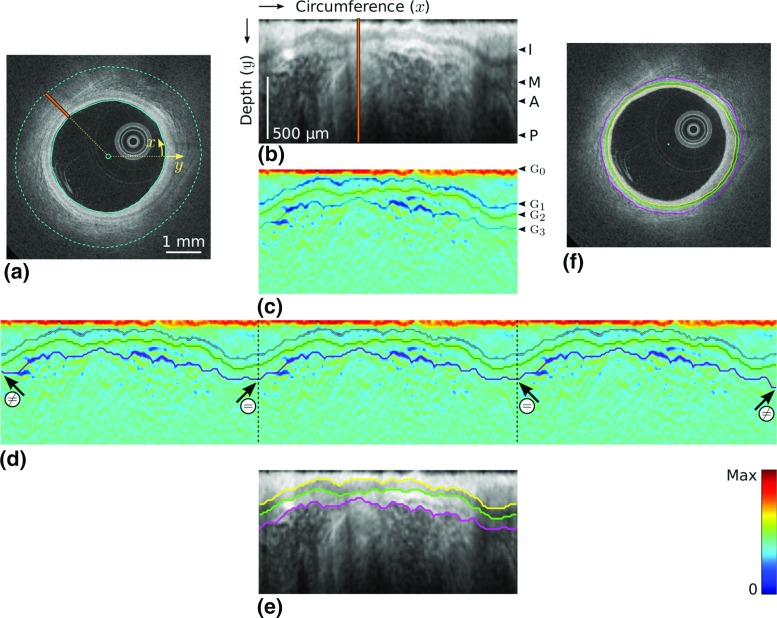
Fig. 2.
Principal steps of the segmentation process. In this example, the wall is entirely healthy and the anatomical layers are visible around the whole circumference. a Original image, with the lumen contour (solid cyan line). The depth is indicated by the dashed cyan line. b Sub-image I, corresponding to the area between the two cyan lines in (a). The intima (I), media (M) and adventitia (A) layers, as well as the periadventitial tissues (P) are clearly visible. The orange line represents a single column, which corresponds to the orange line in (a). c Gradient image . The IM, MA and AP interfaces, located in regions with extremum gradients values , are delineated, although they are not determined yet at this stage of the process. d Replicated image , with the IM (yellow), MA (green) and AP (magenta) contours resulting from the segmentation method. The contours within the central part of the image systematically respect the condition of continuity (), even though the contours of the total image do not (). e Segmentation result in the polar space, corresponding to the contours within the central part of . f Final segmentation result in the Cartesian space

