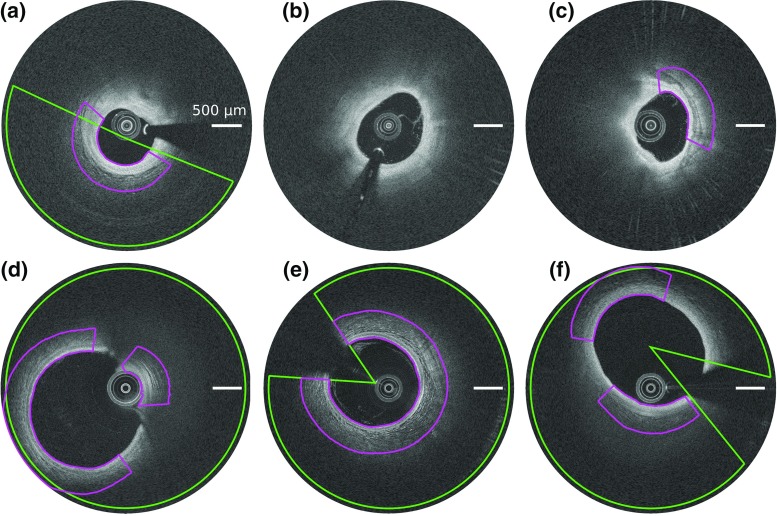
Fig. 6.
Examples of automatic healthy wall detection (magenta) compared to the manual tracings performed by (green), for images of the testing set. The entire spectrum of results is represented. The panels (a–c) and (d–f) correspond to the SJM-OCT and Terumo-OCT cohorts, respectively. a The wall is partly healthy. b, c The entire circumference is diseased. d–f The entire circumference is healthy. a, b, e High agreement. c Failure, calcifications are wrongly detected by the method as this region has a layered appearance similar to a healthy wall structure. d Failure due to the tangential penetration angle of the probe, in contact with the arterial wall. f Failure, part of the healthy region is not detected by the method as the three anatomical layers are poorly visible

