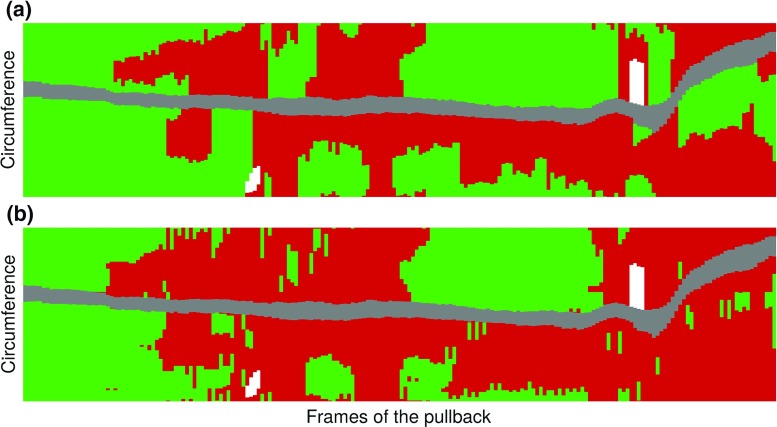
Fig. 8.
Example of the comparison of manual annotations (a) and automatic classification (b) in the first 200 frames of a pullback. Healthy regions, diseased regions, guidewire shadow, and sidebranches are represented in green, red, gray, and white, respectively. The Dice coefficient is equal to 0.80. The x and y axes represent the length of the arterial segment imaged during the pullback, and the angle from the lumen center, respectively

