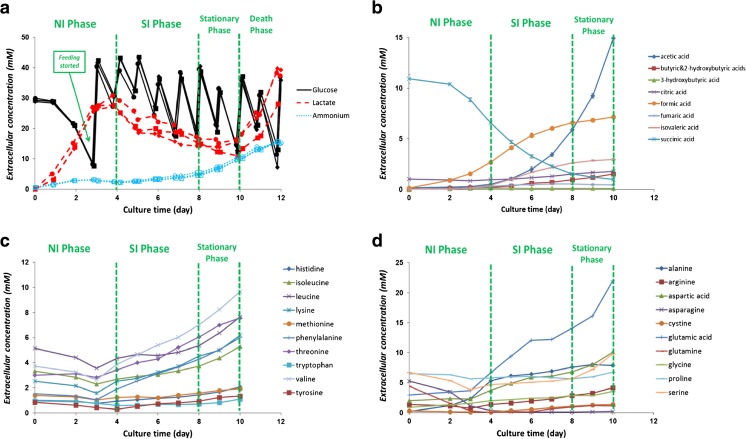
Fig. 2.
a Extracellular glucose (solid lines), lactate (dotted lines with closed marks), and ammonium (dotted lines with open marks) concentrations (mM) of reactor 1 (circles), 2 (diamonds), and 3 (squares). (b) Extracellular concentrations of measured organic acids. (c) Extracellular concentrations of essential amino acids. (d) Extracellular concentrations of non-essential amino acids. Feeding started on day 3. For glucose, lactate, and ammonium, samples were taken daily before and after feed addition. For the other organic acids and amino acids, samples were taken daily before feed addition. Error bars for all graphs indicate the standard deviation for the triplicate bioreactors

