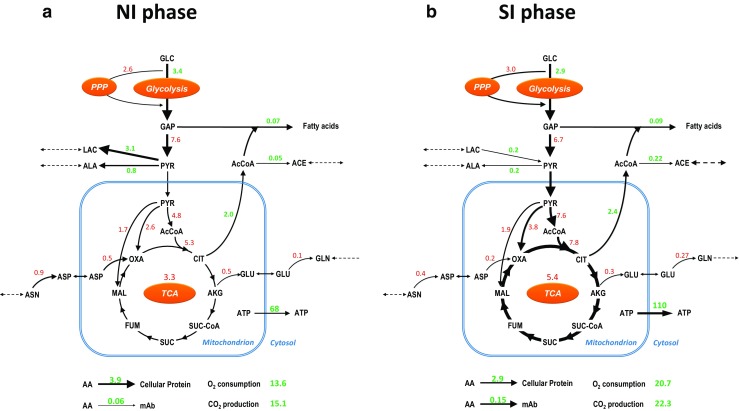
Fig. 7.

Major metabolic flux changes between (a) the number increase (NI) and size increase (SI) phase during the fed-batch cultures. The line thickness indicates the relative flux changes between the two presented phases. The average flux of the TCA cycle is represented by the average fluxes between the flux from citrate (CIT) to α-ketoglutarate (AKG) and the flux from succinate (SUC) to fumarate (FUM). The colors of the flux values indicate the flux variability result between the two phases. The green values show no overlap of the variable flux values between the two phases whereas the red values show there is overlap. The unit for flux values is mmol × 10−9 cells × day−1
