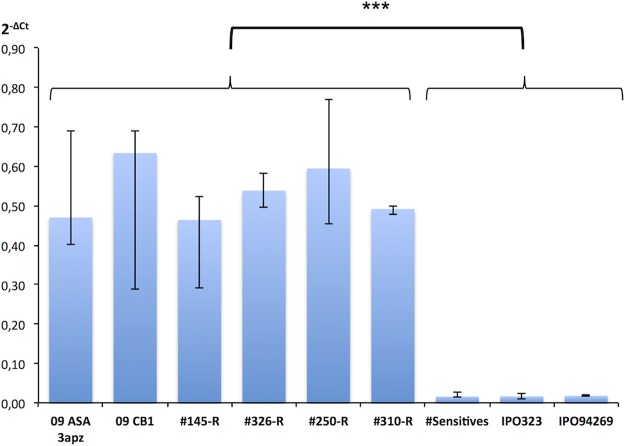
FIG 3 .
MFS1 expression in parental and progeny strains. MFS1 expression was measured by qRT-PCR relative to three reference genes (β-tubulin, eF1a, and actin). Median values (n = 4 to 12) and interquartile range are indicated in the plot. Progeny strains with an “R” suffix are of the MDR phenotype. The value plotted as “#Sensitives” corresponds to expression data from six independent sensitive strains (n = 12). ***, significant difference of the MFS1 expression levels between MDR and sensitive strains according to Kruskall and Wallis’ nonparametric statistical test with a risk threshold at 0.1%.

