
Fig 5.
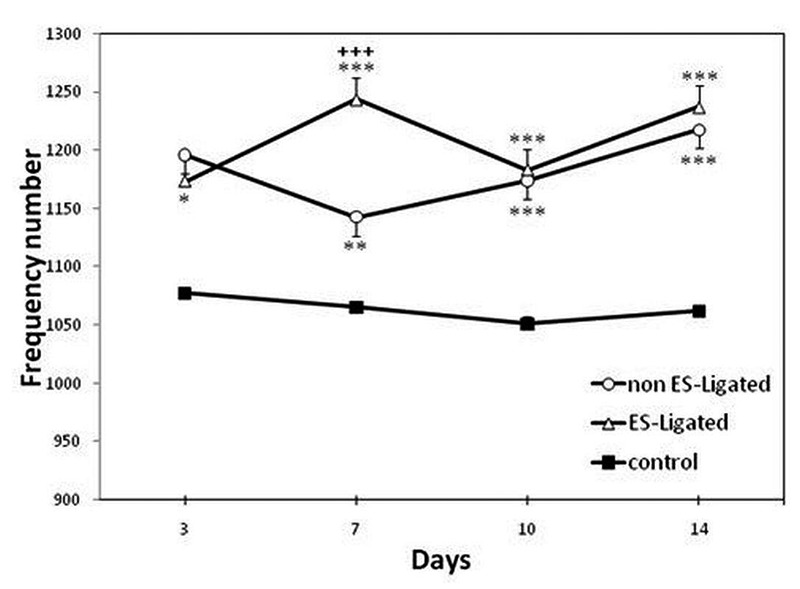
Effect of electrical stimulation on Biceps femoris muscle sensitivity. The EMG signal was recorded on the 3rd, 7th, 10th, 14th day after ligation in non ES-Ligated group (o), ES- Ligated group (Δ) and control group (∎). Each point is mean ± SEM of the frequency number for 10 mice. (*p<0.05, **p<0.01, ***p<0.001 different from respective control group, +++ p<0.001 different from respective non ES-Ligated group).