Figure 3.

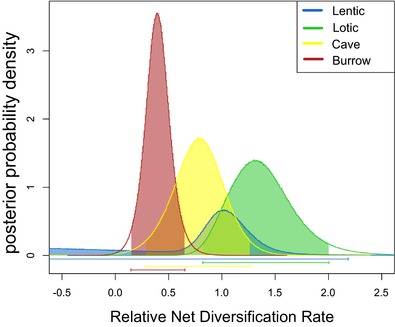
Relative net diversification rates estimated from separate GeoSSE analyses for each habitat type over 1000 bootstrap phylogenies.

Relative net diversification rates estimated from separate GeoSSE analyses for each habitat type over 1000 bootstrap phylogenies.