
Figure 2.
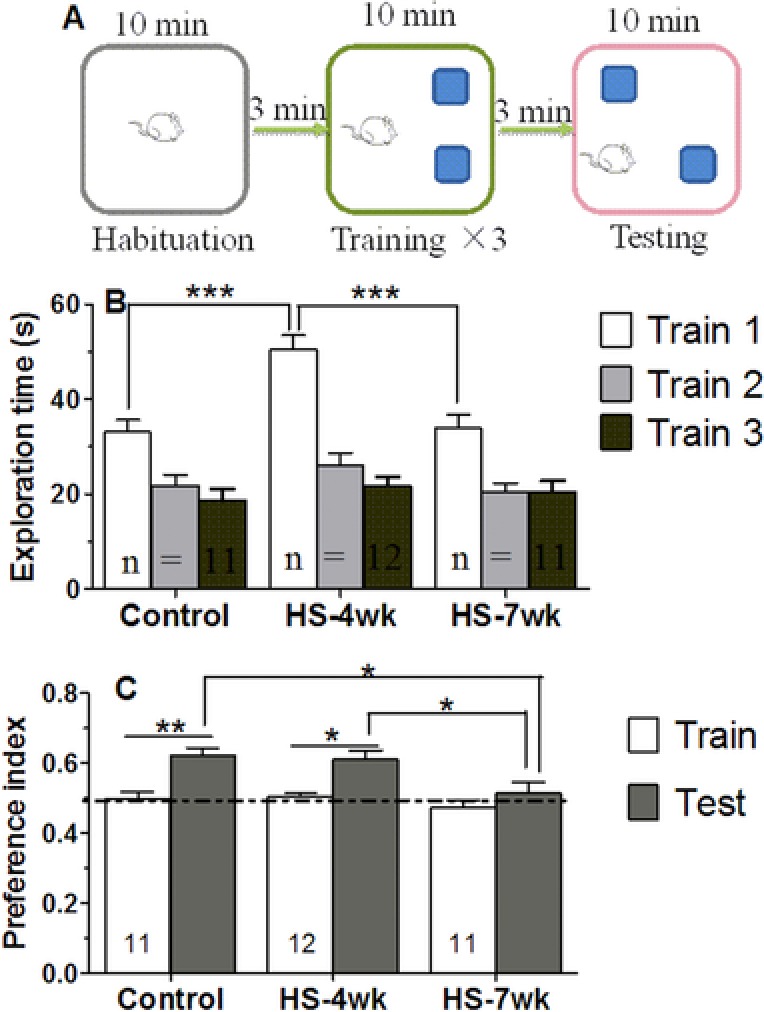
HS mice have impaired short‐term memory for object location. (A) Diagram illustrating the experimental design for object‐place recognition. (B) Bar graphs showing the total exploration times for the three groups. (C) Graphs showing the percentage preference for the displaced object after 3 min. Dotted line denotes 50% preference index. Bars are mean ± SEM, n ≥ 8 mice, * p < 0.05, ** p < 0.01, *** p < 0.001.