
Figure 5.
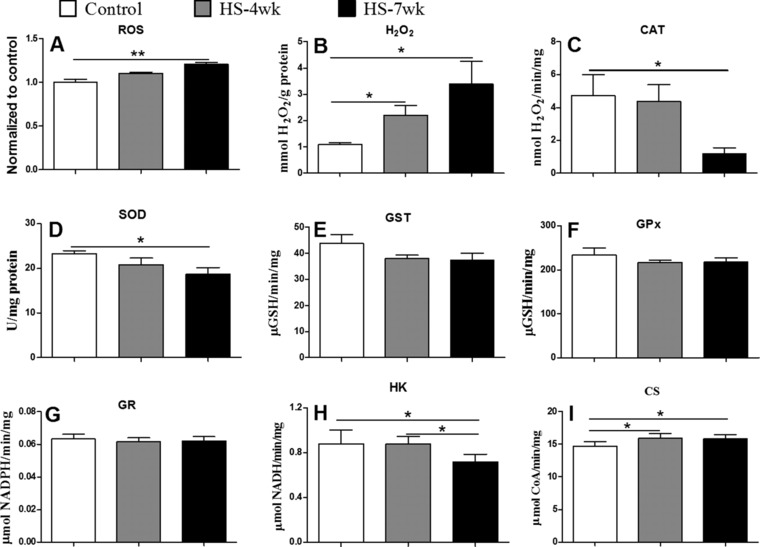
Markers of oxidative stress in mice fed normal or high salt diets. Concentrations of ROS (A), and H2O2 (B), and the enzyme activities of CAT (C), SOD (D), GST (E), GPx (F), GR (G), HK (H), and CS (I), were measured as described in the Materials and methods. Bars are mean ± SEM, n = 4–6, * p < 0.05, ** p < 0.01.